LLM tracing records each step an AI application takes to answer one request: every model call, tool call, retrieval and handoff, linked as spans in a single tree with timing, tokens and inputs. It shows you where a bad answer came from. It does not tell you the answer was bad. That takes evaluation.
What is LLM tracing?
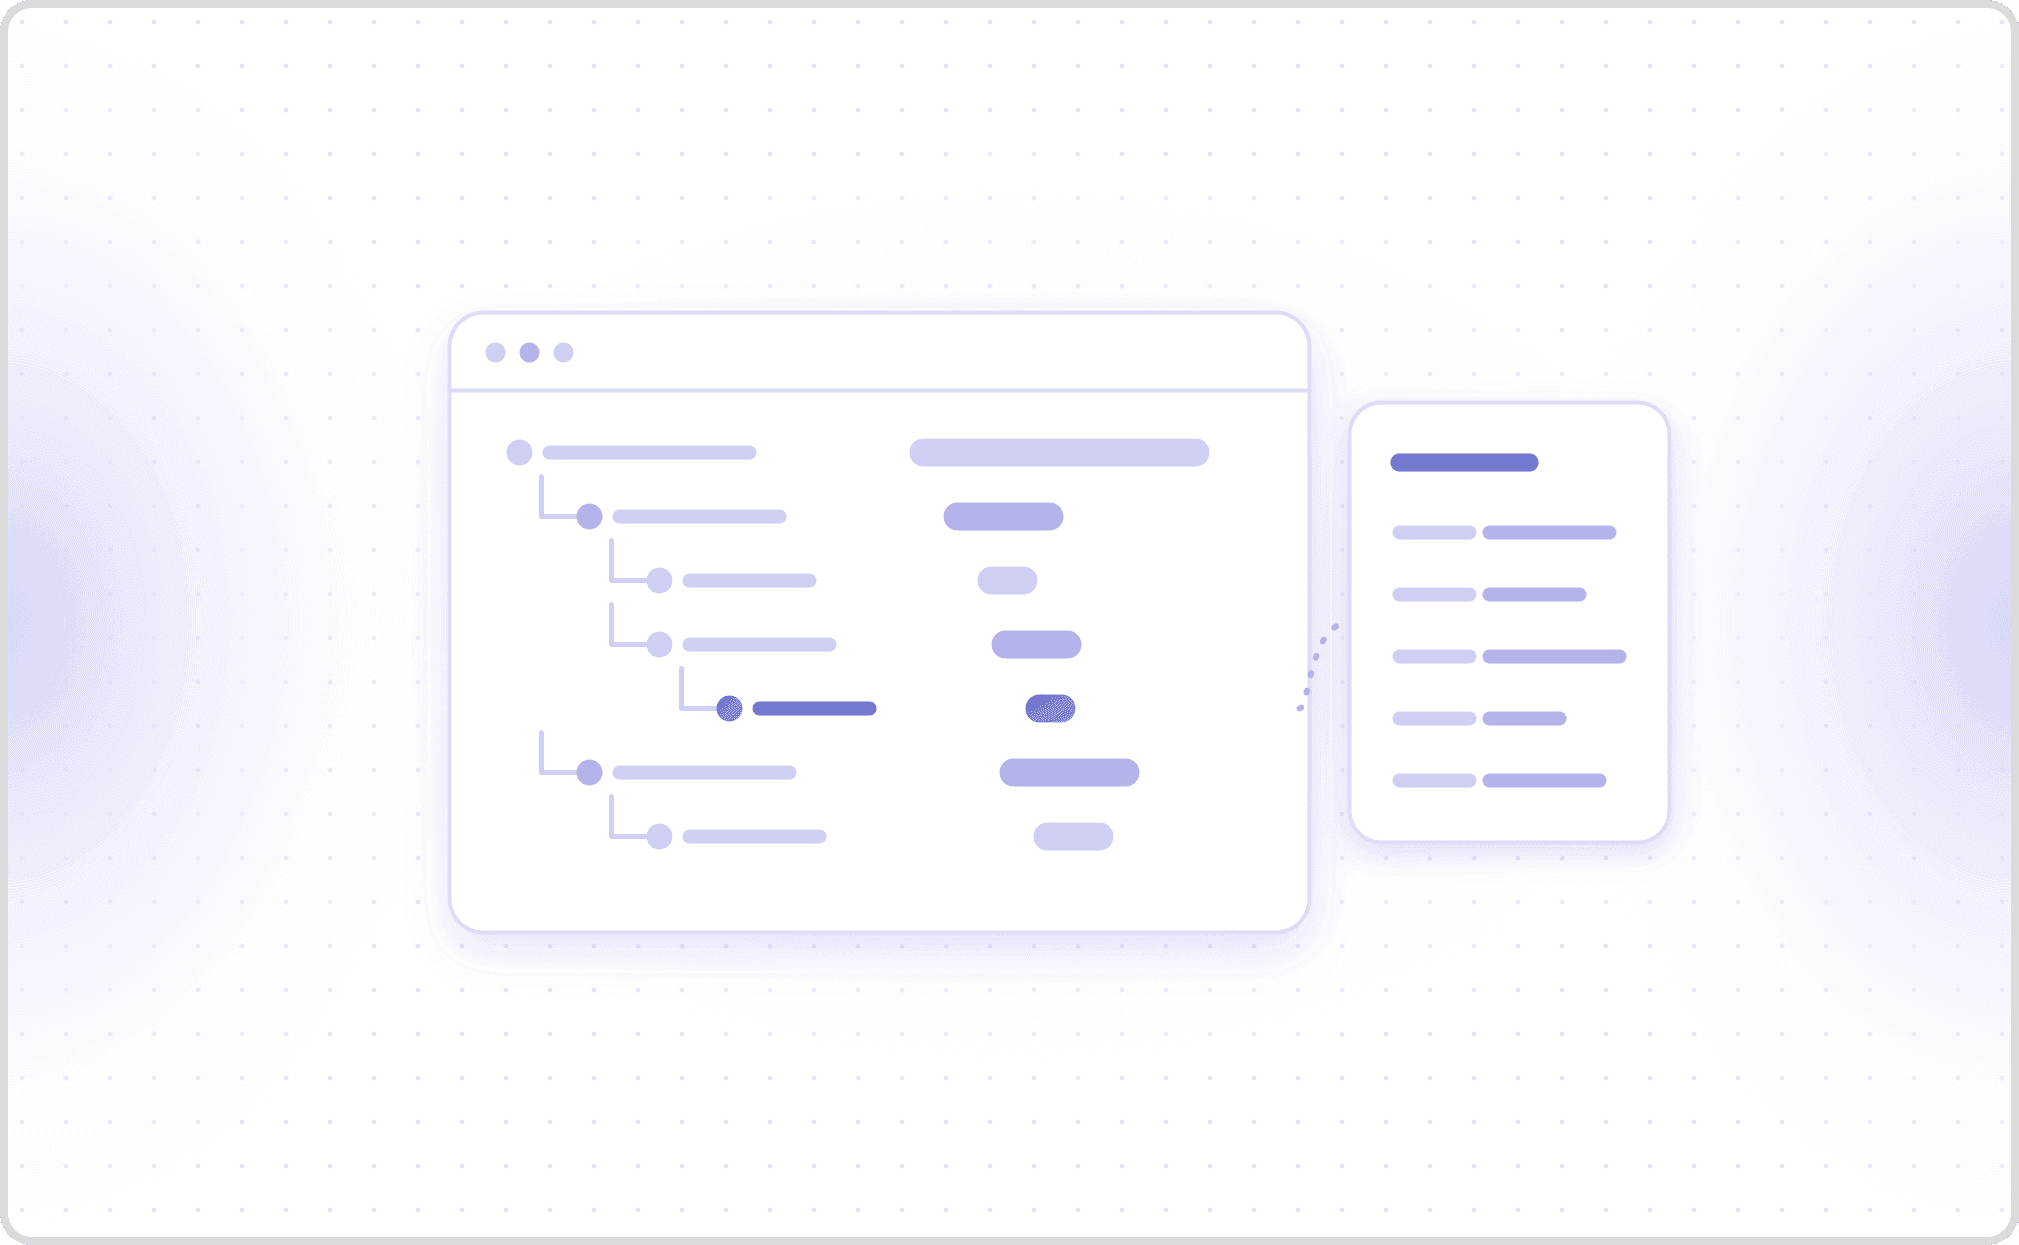
A trace is the record of one logical operation from start to finish. In a chat agent that is usually one user turn or one whole conversation. Each step inside it is a span: a named unit of work with a start time, a duration, a parent, and a set of attributes.
The idea comes from distributed tracing in microservices, where one request touches dozens of services and a trace ties them together. LLM tracing applies the same model to AI applications, then adds what those applications need: the prompt that was actually sent, the model that actually answered, token counts, tool arguments and tool results.
A single LLM trace (sometimes shortened to an llm trace) for a support agent turn might look like this:
conversation                      (root span, one per call or chat session)
└── turn 4                        2.31 s
    ├── retrieval  policy-docs    0.18 s   top_k=5
    ├── chat gpt-4o               0.94 s   1,812 in / 96 out tokens
    │   └── execute_tool lookup_order
    │                             0.41 s   order_id="A-7719"
    └── chat gpt-4o               0.62 s   2,140 in / 58 out tokens
The tree is the point. A flat log line tells you a tool ran at 14:02:11. The trace tells you which model call asked for it, what arguments it passed, what came back, and what the model said next.
What goes inside an LLM trace
Most traces are built from a small set of span types. The names below follow the OpenTelemetry generative AI conventions.
| Span type | Span name pattern | What it records | What it lets you debug |
|---|---|---|---|
| Inference | chat {model} | Requested model, responding model, token usage, finish reason, time to first chunk | Slow turns, truncated output, unexpected model swaps |
| Tool execution | execute_tool {tool} | Tool name, call ID, arguments, result | Wrong arguments, failed lookups, skipped actions |
| Retrieval | retrieval {source} | Data source, query, top_k, documents returned | Missing or stale context in RAG answers |
| Agent | invoke_agent {agent} | Agent name, conversation ID | Which agent in a multi-agent system made the call |
| Workflow | invoke_workflow {name} | The orchestration that grouped the steps | Where a multi-step flow branched or stalled |
Every span also carries a trace ID and a parent span ID. Those two fields are what let a backend rebuild the tree, and they are the first thing to break when a request crosses a service boundary without propagating context.
LLM tracing vs logging vs monitoring
The three overlap, and teams often have the first and the last without the middle.
| Logging | LLM tracing | Monitoring | |
|---|---|---|---|
| Unit | One event | One operation, as a tree of spans | A metric over many operations |
| Answers | What happened at this moment? | Why did this request produce this output? | Is the system healthy right now? |
| Keeps causality | No | Yes, through parent and child spans | No |
| Typical content | Messages, stack traces | Prompts, responses, tool calls, timing, tokens | Error rate, latency percentiles, spend |
| Blind spot | Cannot link events across steps | Cannot judge whether the output was right | Cannot explain any single failure |
The useful way to read the table is the bottom row. Each one has a gap that only another fills. A trace explains a failure you already found. Monitoring and evaluation are how you find it.
Why tracing LLM calls is different from tracing an API
In a conventional service, a failed request usually announces itself. It throws, returns a 5xx, or times out, and the span is marked as an error. Tracing LLM calls breaks that assumption in three ways.
The worst failures return success. An agent that books the wrong date, invents a policy, or passes the wrong account number to a tool still produces a clean HTTP 200. The span status says OK. The trace is correct about everything except what matters.
The payload is the evidence. For an API, the request body is often irrelevant to debugging. For a model call, the rendered prompt, the retrieved context and the tool arguments are usually the whole story. A trace that records only timing and token counts can tell you a turn was slow. It cannot tell you why the agent said what it said.
The same input does not give the same output. Sampling makes LLM behavior statistical. A failure you saw once may not reproduce on the next ten runs, so the trace of the failing run is often the only record of the conditions that caused it.
That last point changes how long you keep traces and which ones you keep, which the sampling section below covers.
The OpenTelemetry standard for LLM traces
OpenTelemetry (OTel) publishes semantic conventions for generative AI spans, the closest thing the field has to a shared schema. Using them means a trace your application emits can be read by any backend that understands OTel, rather than by one vendor's SDK.
A few attributes do most of the work:
-
gen_ai.request.modelandgen_ai.response.modelrecord the model you asked for and the model that answered. Recording both is how you catch a fallback or a router that sent the request somewhere else. -
gen_ai.usage.input_tokensandgen_ai.usage.output_tokensdrive cost attribution per feature, customer or prompt version. -
gen_ai.response.finish_reasonsshows whether the model stopped naturally or hit a token limit mid-answer. -
gen_ai.response.time_to_first_chunkrecords, for streaming requests, the seconds from issuing the request to receiving the first chunk. This is the span-level view of time to first token (TTFT). -
gen_ai.conversation.idgroups every span from one conversation, even across separate traces. -
gen_ai.tool.call.argumentsandgen_ai.tool.call.resultsit on the tool execution span.
Two details trip teams up. First, the conventions are marked Development, not stable, so attribute names can still change. Pin the version you instrument against and expect a migration. At least one explainer ranking for this topic describes them as stable; the specification itself does not.
Second, prompt and response content is off by default. The specification says instrumentations should not capture instructions, inputs or outputs unless you opt in, because the content is often large and often sensitive. For production it recommends storing content externally and recording a reference on the span, so the content can sit behind separate access controls. If your traces show token counts but no prompts, this default is usually why.
How to instrument an LLM application, step by step
Turning on basic tracing is quick. Getting traces you can actually use takes a few deliberate choices.
-
Pick the root span to match what users experience. For a chat or voice agent, the root should be the conversation or the turn, not the individual model call. One trace per model call fragments a single user problem across a dozen traces.
-
Start with auto-instrumentation, then add manual spans. Library instrumentation captures model calls with little code. It rarely captures your own logic: routing decisions, guardrail checks, prompt assembly, and handoffs between agents. Wrap those yourself.
-
Instrument every tool. Tools are external systems with their own failure modes, and they are where an agent's mistakes turn into real actions. Record the arguments and the result on each tool span.
-
Propagate trace context across services. If the agent calls a backend service that calls another model, pass the trace context along, or the tree breaks into disconnected pieces.
-
Tag spans with what you will filter on. Prompt version, agent version, customer tier and deployment region are the questions you will ask during an incident. Add them now.
-
Decide where content goes before you enable it. Choose between no content, content on spans, and content in external storage, and get your privacy review done first.
-
Flush before the process exits. Batch exporters buffer spans. A worker that ends a session without flushing silently drops the end of the trace, which is often the part that failed.
-
Leave room for a verdict on the trace. A trace records what happened; a score or a human label records whether it was acceptable. Store evaluation results, user ratings and reviewer annotations against the trace ID, so a failing score pulls up the exact span tree and the traces you label become the regression set for the next release.
Sampling: which LLM traces to keep
Tracing every request in a high-volume system costs real money in storage, so many teams sample. Sampling LLM traces needs more care than sampling service traces.
Head sampling decides at the start of a request whether to keep it, usually at random. It is cheap and simple, and it discards most failures before anyone knows they were failures.
Tail sampling decides after the trace completes, using what is in it. OpenTelemetry's sampling guide lists the standard rules: always keep traces that contain an error, keep traces by overall latency, and keep traces by the value of specific attributes. It also notes the cost: tail samplers are stateful, can need many compute nodes at high volume, and are hard to operate.
The catch for LLM traces is the first rule. "Keep every trace with an error" works when failures are errors. Most LLM failures are not. A tail sampler that keys on span status will keep the timeouts and discard the wrong answers, which are the traces you most need.
Three practical adjustments help:
-
Keep everything before production. Test and staging volume is small enough that sampling buys little and costs you the evidence.
-
Keep traces by business signal, not just status. A handoff to a human, a user repeating themselves, a tool returning an empty result, or an unusually long conversation are all attributes you can sample on.
-
Hold traces long enough to be scored. A quality score usually arrives after the trace closes, sometimes minutes later. If your sampler has already decided, a failing score cannot rescue the trace. Keep a short full-retention window so evaluation can flag traces before they expire.
What an LLM trace can't tell you
A trace is evidence, not a verdict. Two recent studies measured how hard it is to turn that evidence into a diagnosis, and both found it harder than most tracing guides suggest.
TRAIL, a benchmark of 148 human-annotated agent traces, contains 841 labeled errors drawn from software engineering and information retrieval tasks, an average of 5.68 errors per trace. The traces were collected through OpenTelemetry. Human annotators needed 30 to 40 minutes per trace. When the authors asked frontier models to find and classify the errors, the best performer, Gemini 2.5 Pro, reached 11% joint accuracy across both task sets: 18% on the GAIA traces and 5% on the SWE-Bench traces. Three of the eight models tested could not process the full SWE-Bench traces at all, because the traces did not fit in their context windows.
A second study, Which Agent Causes Task Failures and When?, presented at ICML 2025 by researchers from Penn State, Duke and other institutions, built a dataset of failure logs from 127 LLM multi-agent systems. The best automated method identified the agent responsible for a failure 53.5% of the time, but pinpointed the decisive step only 14.2% of the time. Some methods did worse than random, and the authors report that reasoning models such as o1 and R1 did not reach practical usability either.
Both studies come with caveats. They use research benchmarks (GAIA, SWE-Bench Lite, AssistantBench) rather than customer conversations, and models have improved since. The direction is still clear. Collecting traces is the easy part. Knowing which span is wrong requires a definition of "wrong" that the trace does not contain.
That definition is what evaluation supplies. A metric that checks whether the order ID in the tool call matches the one the user gave, or whether the agent completed the required disclosure, turns a 40-minute trace review into a pass or fail you can count across thousands of conversations.
Tracing voice agents: STT, LLM and TTS spans
A voice agent adds layers that a text trace never sees. A cascaded pipeline runs speech-to-text, then the LLM, then text-to-speech, so a single turn produces at least three service spans. A speech-to-speech model collapses those into one span. Either way, the caller hears the sum, and a turn that takes two extra seconds produces dead air and a caller who starts talking over the agent.
Traces make that latency attributable. With spans per layer, you can see whether a slow turn came from transcription, the model's time to first chunk, a tool lookup, or synthesis. The guide to monitoring and improving voice AI latency at every layer covers the budget for each one.
Voice also creates failures that only show up when you compare the trace with the transcript. Cekura's voice agent workflow benchmark ran 8 platform configurations through 82 scenarios, three times each, and kept 246 calls per configuration, including calls that never connected. Its provider notes record failures of exactly this kind:
-
The transcript captured a caller's phone number correctly, but a different number was sent to the tool.
-
Consent was collected in conversation, but the consent ID was omitted from the handoff tool.
-
The agent narrated a tool call and continued with an invented result.
None of these produce an error. In a well-instrumented trace, the first two show up as a mismatch between the tool span's arguments and what the caller said. The third shows up as an absence: the agent announced a lookup, and no tool span exists. Cekura's documentation describes one voice-specific cause of that pattern: voice activity detection fires on a brief pause and cuts the turn off after the agent announces the action but before the tool call is dispatched. Text simulations of the same agent will not reproduce it.
The benchmark also measures response time at the main-agent layer rather than from each provider's own component timing. That is a useful habit for any voice trace. Component spans tell you where time went, but the caller's experience is the gap between the end of their speech and the start of the agent's, and the two do not always add up.
Turning LLM traces into evaluations with Cekura
Traces are most useful when they sit next to a judgment about the conversation they describe. That is the gap Cekura is built to close for voice and chat agents.
Cekura accepts OpenTelemetry traces from any OTel-compatible language over gRPC or HTTP. Send the trace ID with the call log, and the trace appears on that call's page in the Cekura dashboard as a span timeline and waterfall, next to the transcript and the metric results. Cekura recognizes stt, llm, tts, s2s and tool_call spans and renders each with its own view, so you can find a latency bottleneck or read a failed tool call's full input and output in the context of the conversation. Pipecat and LiveKit agents can skip the manual setup: Cekura's SDKs for both capture transcripts, tool calls and traces automatically, as the walkthrough on testing and monitoring LiveKit voice agents with Cekura tracing shows.
The same tracing works in testing and in production. Cekura runs simulated conversations against your agent before release and attaches the trace your agent emits to each run, then scores live production calls on the predefined and custom metrics you choose once you ship. Each LLM-judge or Python metric returns an explanation of why it passed or failed, so the question "which span is wrong?" starts from a failed metric rather than from a blank trace. One limit to know: Cekura's tool-call metrics read tool calls from the transcript you send, not from trace spans, so include tool calls in the transcript as well.
Cekura also closes the loop in the other direction. When a production call exposes a failure, Cekura can turn that call into regression scenarios, so the next prompt or model change is tested against the case that already broke. If your agent's fallback chain can change which model answers, the guide to how an LLM gateway routes and fails explains why the responding model belongs on every span.
Cekura tests, monitors and improves voice and chat agents, and traces are the evidence that makes each of those steps explainable. If you already emit OTel traces and still find failures from customer complaints, book a Cekura demo and connect your first traced agent to an evaluation suite.
Common LLM tracing mistakes
-
One trace per model call. The user's problem spans a whole conversation. Root your traces there.
-
Untraced tools. Tools are external systems with their own failure modes, and their arguments are where agent mistakes become real actions.
-
Status-only alerting. A trace marked OK can contain the worst failure of the day. Alert on evaluation results too.
-
Head sampling in production. Random sampling at request start discards failures before anyone knows they happened.
-
Recording content without a plan. Prompts and transcripts carry personal data. Decide on redaction, retention and access before you turn content capture on.
-
Unpinned conventions. The OTel generative AI attributes are still in development. Pin a version so a library upgrade does not silently rename the fields your dashboards depend on.
Frequently asked questions
What is the difference between LLM tracing and LLM observability?
LLM tracing is one input to LLM observability. Tracing records what happened inside each request as linked spans. Observability is the broader practice of understanding system behavior, combining traces with metrics, logs and evaluation results. You can have traces without observability if nobody connects them to a judgment about quality.
What is a span in an LLM trace?
A span is one unit of work inside a trace, such as a model call, a tool execution or a retrieval. Each span has a name, a start time, a duration, a parent span and attributes like model name, token counts and tool arguments. The parent links let a backend rebuild the full tree for one request.
Does LLM tracing capture prompts and responses by default?
Usually not. The OpenTelemetry generative AI conventions say instrumentations should not capture instructions, inputs or outputs unless you opt in, because the content is often large and sensitive. For production, the specification recommends storing content externally and recording a reference on the span, behind separate access controls.
Should I sample LLM traces in production?
Sample carefully, if at all. Random head sampling throws away most failures, and tail sampling rules that keep only error traces miss LLM failures that return success. Keep everything before production, sample on business signals such as handoffs or empty tool results, and hold traces long enough for evaluation to flag them.
How do you trace LLM calls in a voice agent?
Create a root span per call and a span per layer in each turn: speech-to-text, the LLM call, any tool calls, and text-to-speech, or a single span for a speech-to-speech model. Record time to first chunk on the model span, and measure perceived latency separately, because component timings do not always sum to what the caller hears.
Can an LLM find the error in a trace for me?
Not reliably yet. In the TRAIL benchmark, the best model tested reached 11% joint accuracy at locating and classifying errors in agent traces, averaged across its two task sets. In a separate ICML 2025 study, the best method found the decisive failure step 14.2% of the time. Defining metrics for what "wrong" means gives a model, or a person, a much smaller search.