
Voice AI latency is the time a caller waits for the agent to respond, but that single pause is produced by an entire real-time pipeline: endpointing, speech recognition, orchestration, model inference, tool calls, speech synthesis, and audio transport.
If you only track an average response time, you know that some calls are slow. You do not know which callers experienced the delay, which layer caused it, or whether a prompt, provider, tool, region, or traffic spike introduced the regression.
This guide defines the latency metrics voice AI teams use, shows where each clock starts and stops, and explains how to turn those measurements into a practical monitoring and triage workflow.
Where Latency Accumulates in a Voice AI Stack
A simplified conversational turn looks like this:
   Caller audio
    ↓
   Network and media transport
    ↓
   VAD and endpointing ────── decides the caller's turn is complete
    ↓
   ASR / STT ──────────────── produces a usable transcript
    ↓
   Orchestrator ───────────── builds context, routes work, calls tools
    ↓
   LLM ────────────────────── generates the response
    ↓
   TTS ────────────────────── creates playable speech
    ↓
   Network, jitter buffer, and playback
    ↓
   Caller hears the agent
This diagram is useful, but it hides an important implementation detail: modern voice systems stream and overlap work. ASR creates partial transcripts before the caller stops. An LLM streams tokens while it is still generating. TTS can synthesize a phrase before the full answer exists. Audio transport begins before synthesis finishes.
That is why you should measure both:
- End-to-end latency, which reflects the caller's experience.
- Component latency, which identifies the layer that owns the delay.
Do not expect the component values to add up perfectly. Overlapping spans, buffering, different clocks, retries, and instrumentation gaps can make the sum misleading.
Voice AI Latency Metrics and Their Boundaries
Teams often use the same acronym for different intervals. Before comparing a dashboard, provider report, or benchmark, document the start event, end event, observation point, and whether the value is measured on the client, server, or media edge.
| Metric | Start event | End event | What it isolates |
|---|---|---|---|
| Endpointing delay | Last detected user speech | End-of-turn decision | How long the system waits before committing the turn |
| ASR finalization latency | End-of-turn decision | Final transcript available | Recognition finalization after endpointing |
| LLM TTFT | Model request sent | First output token received | Prompt processing, queueing, and initial model generation |
| Tool latency | Tool request sent | Tool result available | Database, CRM, API, or workflow dependency |
| TTS first-byte latency | Speakable text sent to TTS | First audio bytes received | Provider queueing and initial synthesis |
| Time to first audio (TTFA) | A defined turn boundary | First playable or audible audio | Caller-facing responsiveness across multiple stages |
| End-to-end response latency | User finishes speaking | Agent begins speaking | The complete conversational handoff |
| Interruption stop time | Caller begins barge-in | Agent audio stops | How quickly the system yields the floor |
Two cautions matter here.
First, TTFA is not universally defined. One provider may start its clock when a transcript is finalized and stop when it sends an audio packet. Another may measure from the last user audio frame to playback at the client. Both can label the result TTFA while measuring different work. Publish the boundary with the number.
Second, end-of-user-speech is only knowable after the fact. A live system detects it through VAD and endpointing. If your response-latency clock starts only after endpointing fires, endpointing delay disappears from the metric even though the caller still experienced it.
Average vs. p50 vs. p95 vs. p99 Latency
An average compresses every turn into one number. It is useful for capacity trends, but it can hide a small group of extremely slow turns. Percentiles show the distribution.
| Statistic | Meaning | Best use |
|---|---|---|
| Mean (average) | Sum of all measurements divided by their count | Broad shifts in system load or capacity |
| p50 (median) | Half of turns are faster and half are slower | The typical caller experience |
| p90 | 90% of turns are at or below this value | A stable tail measure for moderate sample sizes |
| p95 | 95% of turns are at or below this value | Operational alerting and release comparisons |
| p99 | 99% of turns are at or below this value | Rare but severe delays at sufficiently high volume |
Suppose 94 turns take 800 ms and six take 4 seconds. The average is 992 ms, and the median is still 800 ms. Using the nearest-rank method, p95 is 4 seconds, exposing the slow experience that causes callers to ask “Are you still there?”
Track at least p50 and p95. Add p99 only when the measurement window contains enough comparable turns to make it stable. At low volume, one outlier can move p99 dramatically. Measure percentiles over turns rather than whole calls, keep the sample count beside every percentile, and never average already-computed percentiles across time buckets.
Cekura's Voice AI Provider Benchmarks publishes measured response times across current voice platforms, run on the same scenarios and stack configuration, as a like-for-like reference.
For the statistical details and sample-size caveats, see Cekura's dedicated guide to p99 latency in voice AI.
Endpointing Latency: The Delay Before Processing Begins
Endpointing decides whether a pause means “the caller is done” or “the caller is thinking.” It is one of the biggest latency-quality tradeoffs in the stack.
- Wait too long: every turn gains avoidable dead air.
- Decide too early: the agent cuts off hesitations, dates, account numbers, or multi-clause requests.
- Treat noise as speech: the end-of-turn timer may repeatedly reset.
Voice activity detection (VAD) supplies acoustic speech-versus-silence signals, but endpointing may also use transcript finalization, punctuation, turn-completion models, and fixed silence thresholds. Treat VAD and endpointing as related but separate concepts: VAD detects speech activity; endpointing decides that the conversational turn has ended.
Measure endpointing delay from the final detected user-speech frame to the committed end-of-turn event. Then evaluate it alongside false cutoff rate, interruption rate, and task success. A shorter delay is not an improvement if it causes the agent to answer before the user finishes.
Read the deeper guides to voice activity detection and endpointing and turn detection.
ASR Latency: Partial Transcripts vs. Final Transcripts
ASR latency is the time required to turn incoming audio into text the agent can use. In a streaming system, that produces at least two meaningful events:
- First partial transcript: text begins arriving while the caller is still speaking.
- Final transcript: the ASR provider marks the utterance complete and stable.
If the orchestrator waits for the final transcript, finalization time sits directly on the critical path. If it safely uses partial transcripts, some recognition work overlaps with the caller's speech and disappears from post-utterance latency.
Do not optimize ASR latency alone. A fast transcript that drops a negation, digit, drug name, or address can send the rest of the pipeline down the wrong path. Pair timing with word error rate (WER), entity accuracy, language, accent, noise condition, and correction rate.
A clean measurement separates endpointing delay from ASR finalization latency. Measuring from “last user speech” to “final transcript” and calling the whole interval ASR latency incorrectly assigns the endpointing policy to the recognition provider.
LLM Latency: TTFT, Generation Speed, and Tool Calls
Time to first token (TTFT) measures the interval from sending the model request to receiving its first output token. It captures model queueing, prompt ingestion, and the start of generation.
TTFT is useful, but it does not describe the whole model path. Also track:
- Input size: long system prompts, conversation histories, retrieved documents, and tool schemas increase prompt-processing work.
- Output tokens per second: once generation starts, slow token throughput can starve TTS.
- Time to first speakable chunk: the first token may be punctuation or too little text for natural synthesis.
- Tool-call duration: an LLM may respond quickly with a tool request and then wait seconds for a CRM, database, or API.
- Number of model and tool round trips: retries and multi-step reasoning compound the tail.
Keep tool latency separate from LLM TTFT. Otherwise a slow account lookup appears to be a slow model, and the team optimizes the wrong dependency.
TTS Latency: First Byte, First Playable Chunk, and Streaming
TTS latency begins when speakable text reaches the synthesizer. Possible end events include the first response byte, the first decoded audio frame, the first playable buffer, or actual playback. These are not interchangeable.
For conversational responsiveness, measure the time to the first playable audio chunk as close to the listener as your instrumentation allows. Also track:
- Real-time factor (RTF): synthesis time divided by the duration of generated audio. An RTF below 1 means audio is produced faster than real time.
- Buffer underruns: audio starts quickly but pauses because synthesis or transport cannot sustain playback.
- Chunk size and buffering policy: larger buffers may sound stable but delay first audio.
- Voice and model: higher-quality voices may trade speed for expressiveness.
- TTS overrun after barge-in: how long agent audio continues after the caller starts speaking.
Streaming reduces perceived latency only when the LLM produces stable, speakable text early enough and the transport can deliver it continuously.
Network and Audio Transport Latency
The last mile can erase gains made elsewhere. SIP trunks, WebRTC media servers, transcoding, geographic routing, jitter buffers, packet loss, and client playback all affect when audio becomes audible.
Track round-trip time, jitter, packet loss, codec, region, carrier or route, and reconnect events with your response metrics. Segmenting is critical: a global p50 can remain flat while one region or telephony route develops a severe p95.
Also distinguish post-dial delay from conversational latency. Post-dial delay happens before a call connects; per-turn latency happens after the session begins. They have different clocks and usually different owners. Cekura's post-dial delay guide explains the boundary.
Why End-to-End Latency Is Not Just a Sum
A useful mental model is:
response latency = critical path through
endpointing + remaining ASR work + orchestration/tools + LLM + TTS + transport
It is not always:
response latency = every recorded component duration added together
ASR can run during speech, LLM tokens can stream into TTS, and audio can stream while later audio is still being synthesized. Conversely, hidden queues and buffers may appear between spans and make end-to-end latency longer than the visible components.
Use one shared trace or correlation ID, synchronize clocks, record event timestamps rather than only durations, and define whether events were observed at the provider, application server, media edge, or caller device. The end-to-end number is the truth about experience; the component spans are hypotheses about ownership.
How to Diagnose a Voice AI Latency Spike
Start with the affected cohort, then move inward from end-to-end timing to component evidence.
| What changed? | Likely area | What to inspect next |
|---|---|---|
| TTFA rises; TTFT is stable | Endpointing, ASR finalization, TTS, or transport | Silence threshold, final transcript timestamp, first audio timestamp, network segment |
| TTFT rises across most turns | LLM path | Model/provider, prompt tokens, concurrency, region, cold starts |
| Only tool-using turns are slow | Integration layer | Tool duration, retries, database query, upstream API p95 |
| p50 is stable; p95/p99 rises | Queueing or an intermittent branch | Concurrency, rate limits, cold starts, retries, specific intents or tools |
| Latency rises in noisy calls | VAD or ASR | Speech detection resets, finalization time, transcript accuracy |
| First audio is fast but speech stutters | TTS or transport | RTF, chunk cadence, jitter buffer, packet loss |
| Agent talks over callers | Endpointing or barge-in | Premature end-of-turn decisions, interruption stop time, stereo audio |
| One region or carrier regresses | Network or routing | Route, codec, media edge, packet loss, regional provider health |
A practical investigation follows five steps:
- Confirm the distribution changed. Compare p50, p95, sample size, and the same time window or release cohort.
- Segment the slow turns. Filter by agent version, scenario, intent, provider, model, tool, region, language, and connection type.
- Open representative calls. Inspect the audio, transcript, timestamps, tool results, and failure metrics for both typical and slow examples.
- Form a component-level hypothesis. For example: “address-verification turns are slow because the CRM tool retries once.”
- Reproduce before shipping. Turn the production pattern into a repeatable scenario, run it under comparable concurrency, and compare the fix against the baseline.
Monitoring Voice AI Performance with Cekura
Out of the box, Cekura measures caller-perceived latency directly from recorded audio using speaker-level timing and voice activity detection (VAD). This captures the conversational delay users actually experience, even when the underlying voice stack does not expose detailed traces. With deeper integrations such as Cekura's tracing SDK and OpenTelemetry, teams can break that delay into STT, LLM, tool, TTS, and transport spans.
Establish a baseline with repeatable simulations
Run the same scenarios across prompt, model, provider, or infrastructure versions. Repetition creates a latency distribution; consistent scenarios make the comparison meaningful. Cekura records per-turn response latency alongside correctness, instruction following, tool-call behavior, interruptions, and other voice metrics, so a faster variant is not declared better when it completes the wrong task.
For capacity-sensitive changes, add concurrent voice-agent load tests. Queueing and rate limits commonly appear in p95 before they move the median.
Build dashboards around distributions and cohorts
Cekura dashboards can visualize metrics over time, aggregate by a selected interval, and filter by agent, test suite, scenario, time range, or production metadata. A useful latency dashboard includes:
- p50 and p95 response latency, with sample count;
- error, timeout, and tool-call success rates;
- silence, interruption, and stop-time metrics;
- task completion or workflow success;
- deployment, prompt, model, and provider version dimensions.
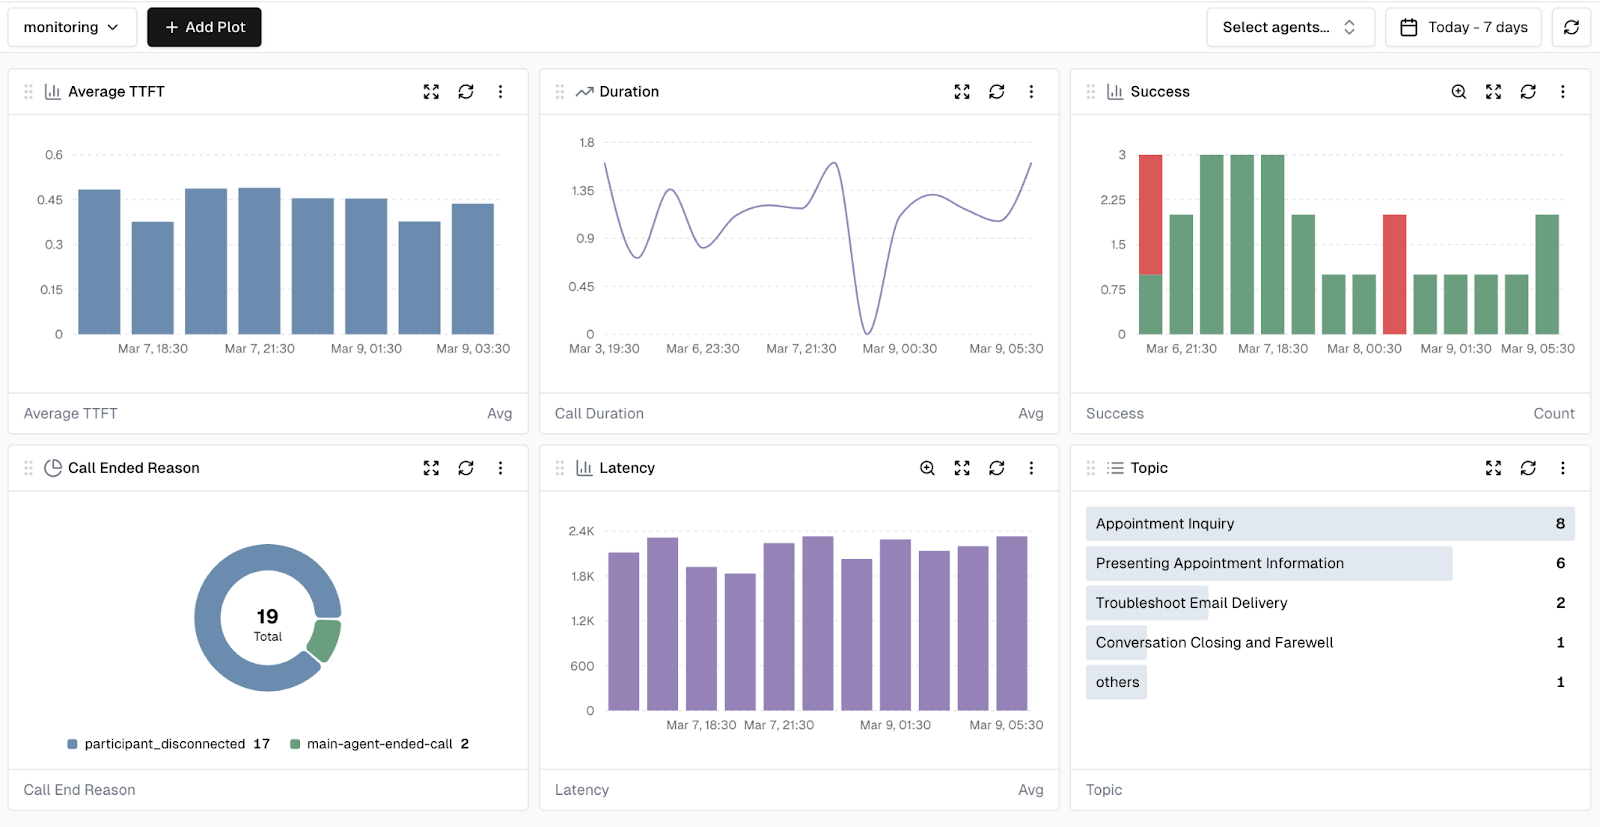
The combination matters. A latency chart tells you when performance moved. Segmentation tells you where. Conversation and outcome metrics tell you whether it harmed users.
Alert on meaningful regressions
Cekura supports metric alerts delivered through Slack and email, plus webhooks for incident-management workflows. Teams can use fixed thresholds where a hard limit is meaningful and significant-change alerts when the important signal is a deviation from the agent's historical baseline.
Avoid paging on a lone p99 value from a tiny sample. Include the metric, baseline, current value, sample count, time window, affected agent or cohort, and direct investigation context in the alert.
Move from the alert to affected calls
When an alert fires, drill into the calls behind the aggregate. Compare a slow turn with a nearby normal turn and inspect the recording, transcript, metric results, timestamps, and tool behavior. With Cekura's tracing SDK, the call-level trace can show the timing and overlap of STT, endpoint detection, LLM, tool, TTS, and speaking spans on the same audio timeline.
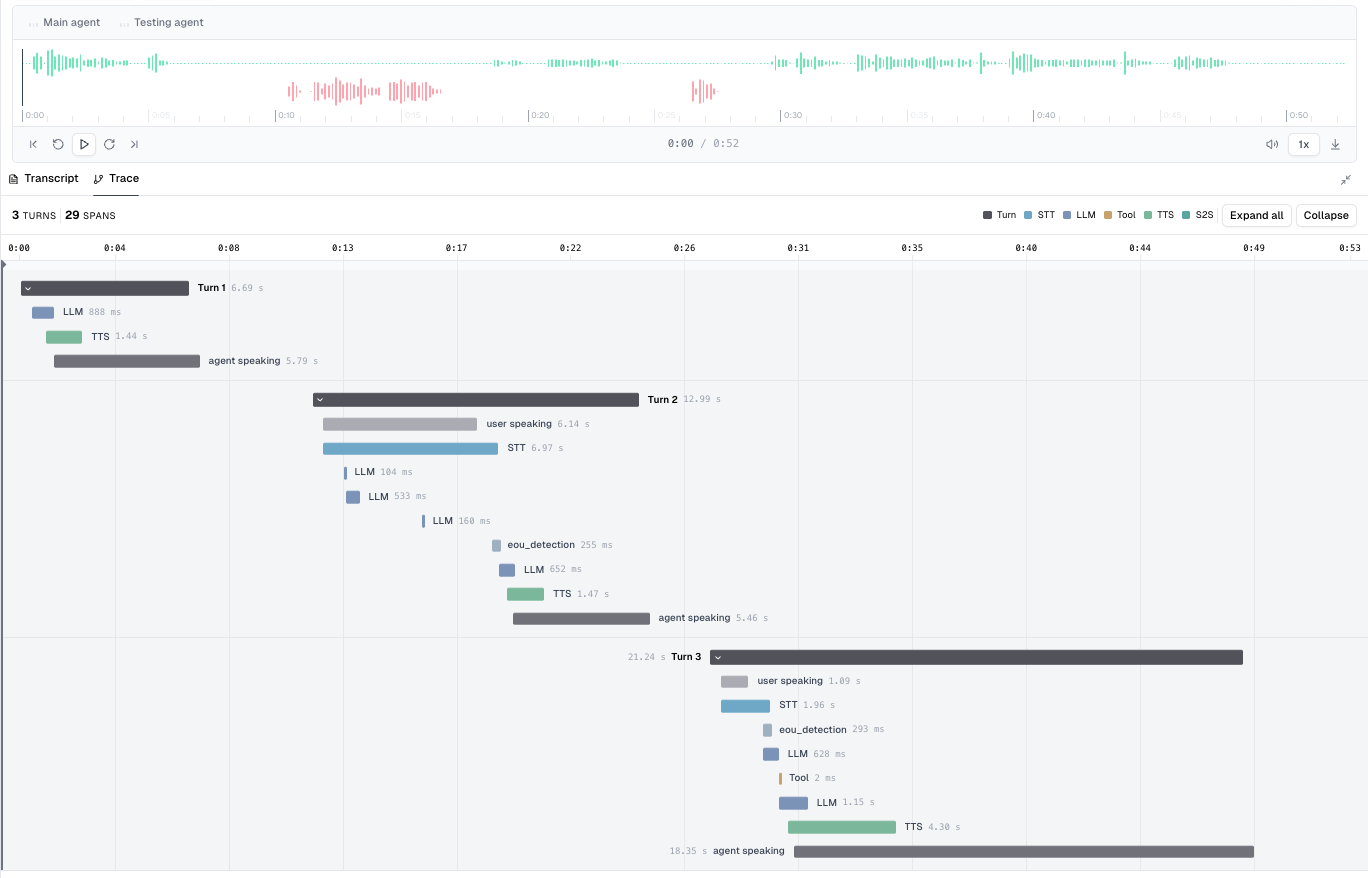
For spans that live in another provider or application observability system, correlate them using the call ID or other shared metadata.
This avoids a common failure in performance triage: seeing that response latency rose and immediately blaming the LLM. The cohort may instead share a long endpointing threshold, a particular tool, a noisy audio condition, a TTS queue, or one network route.
Use Insights to explain recurring failure patterns
Cekura's Failure-Mode Insights groups recurring production-call failures into themes and links them back to affected calls. Insights are most useful as a hypothesis generator: they can show that poor outcomes cluster around a workflow, caller behavior, or repeated failure mode, while the linked call evidence and timing data help the team verify the responsible layer.
For example, an insight may surface repeated balance-check failures with long silence before the response. The team can open those calls, confirm that they all invoke the same tool, and then use tool traces to determine whether the delay is a database query, upstream API, or retry policy. The insight narrows the search; the correlated evidence establishes the cause.
A Practical Voice AI Performance Scorecard
Latency should never be optimized in isolation. Use a scorecard that keeps speed, reliability, and conversation quality together.
| Layer | Latency metric | Guardrail metric | Segment by |
|---|---|---|---|
| Endpointing | End-of-speech to end-of-turn | Premature cutoff and interruption rate | Language, speaking style, noise |
| ASR | Partial/final transcript timing | WER and entity accuracy | Accent, codec, domain vocabulary |
| LLM | TTFT and tokens/sec | Instruction following and factuality | Model, prompt version, input tokens |
| Tools | Tool duration and timeout rate | Tool-call correctness | Tool name, endpoint, response code |
| TTS | First playable audio and RTF | Pronunciation, stutter, overrun | Voice, model, region |
| Transport | RTT, jitter, and packet loss | Drop rate and audio quality | Carrier, protocol, media region |
| End to end | p50, p95, and p99 response latency | Task success, CSAT, abandonment | Workflow, release, customer cohort |
This makes tradeoffs visible. A new endpointing model may reduce p50 by 150 ms but double premature interruptions. A faster LLM may lower TTFT while reducing tool-call accuracy. A TTS voice may produce its first byte quickly but underrun during playback. The best system is not the one with the smallest isolated number; it is the one that completes the caller's task reliably without breaking conversational flow.
Voice AI Latency Checklist
Before trusting a performance report, confirm that you can answer these questions:
- What exact events start and stop each metric?
- Does TTFA mean bytes sent, audio received, playable audio, or sound at the caller?
- Is endpointing included in end-to-end response latency?
- Are measurements per turn, per call, or per provider request?
- How many samples support each percentile?
- Are results segmented by workflow, version, tool, region, and provider?
- Can you move from a chart or alert to the affected calls?
- Can you correlate those calls with application and provider traces?
- Are latency improvements evaluated against accuracy, interruption, and task-success guardrails?
- Can a production failure become a repeatable regression test?
If any answer is unclear, the dashboard may be precise without being actionable.
Frequently Asked Questions
What is a good latency for a voice AI agent?
There is no universal threshold because measurement boundaries, workflows, and caller expectations differ. Human turn transitions set an aggressive perceptual reference: a cross-language study reported a mean response offset of about 208 milliseconds. Today's production voice stacks often operate above that. For a practical comparison, Cekura's Voice AI Provider Benchmarks measures the same agent across major voice platforms, with consistent scenarios and stack configuration, so teams can compare both median and tail latency. Use those results as a reference, then establish a baseline for your exact call path and improve it without increasing cutoffs or errors.
Is TTFT the same as response latency?
No. TTFT measures how long an LLM takes to emit its first token after receiving a request. Response latency includes the voice pipeline around it, such as endpointing, remaining ASR work, tools, TTS, and transport.
What is the difference between TTFA and TTS latency?
TTS latency normally starts when text is sent to the speech synthesizer. TTFA often starts earlier and may include endpointing, ASR, LLM, and tool time. Because vendors define TTFA differently, compare the start and end events rather than the label alone.
Should I monitor average or p95 latency?
Monitor both, but use them for different purposes. The average helps show a broad capacity shift. p95 shows the slow experience affecting one in twenty turns. Pair p50 and p95 for routine monitoring, and add p99 when your sample volume supports it.
How does Cekura help find the cause of latency?
Cekura lets teams detect a regression in dashboards or alerts, segment the affected cohort, inspect linked calls and their conversation evidence, and use Failure-Mode Insights to surface recurring patterns. Engineers can then correlate those calls with provider and application timing to verify whether endpointing, ASR, a model, a tool, TTS, or transport owns the delay.
Measure the Experience, Then Isolate the Layer
The caller experiences one pause, not seven services. Start with end-to-end response latency, use p50 and tail percentiles to understand its distribution, and then break slow turns down by component and cohort.
Cekura brings those steps into one workflow across repeatable simulations and production monitoring: measure the conversation, alert on meaningful change, inspect the affected calls, find the recurring pattern, and turn the fix into a regression test.
Book a demo to see how Cekura can help measure and improve the performance of your voice AI stack.