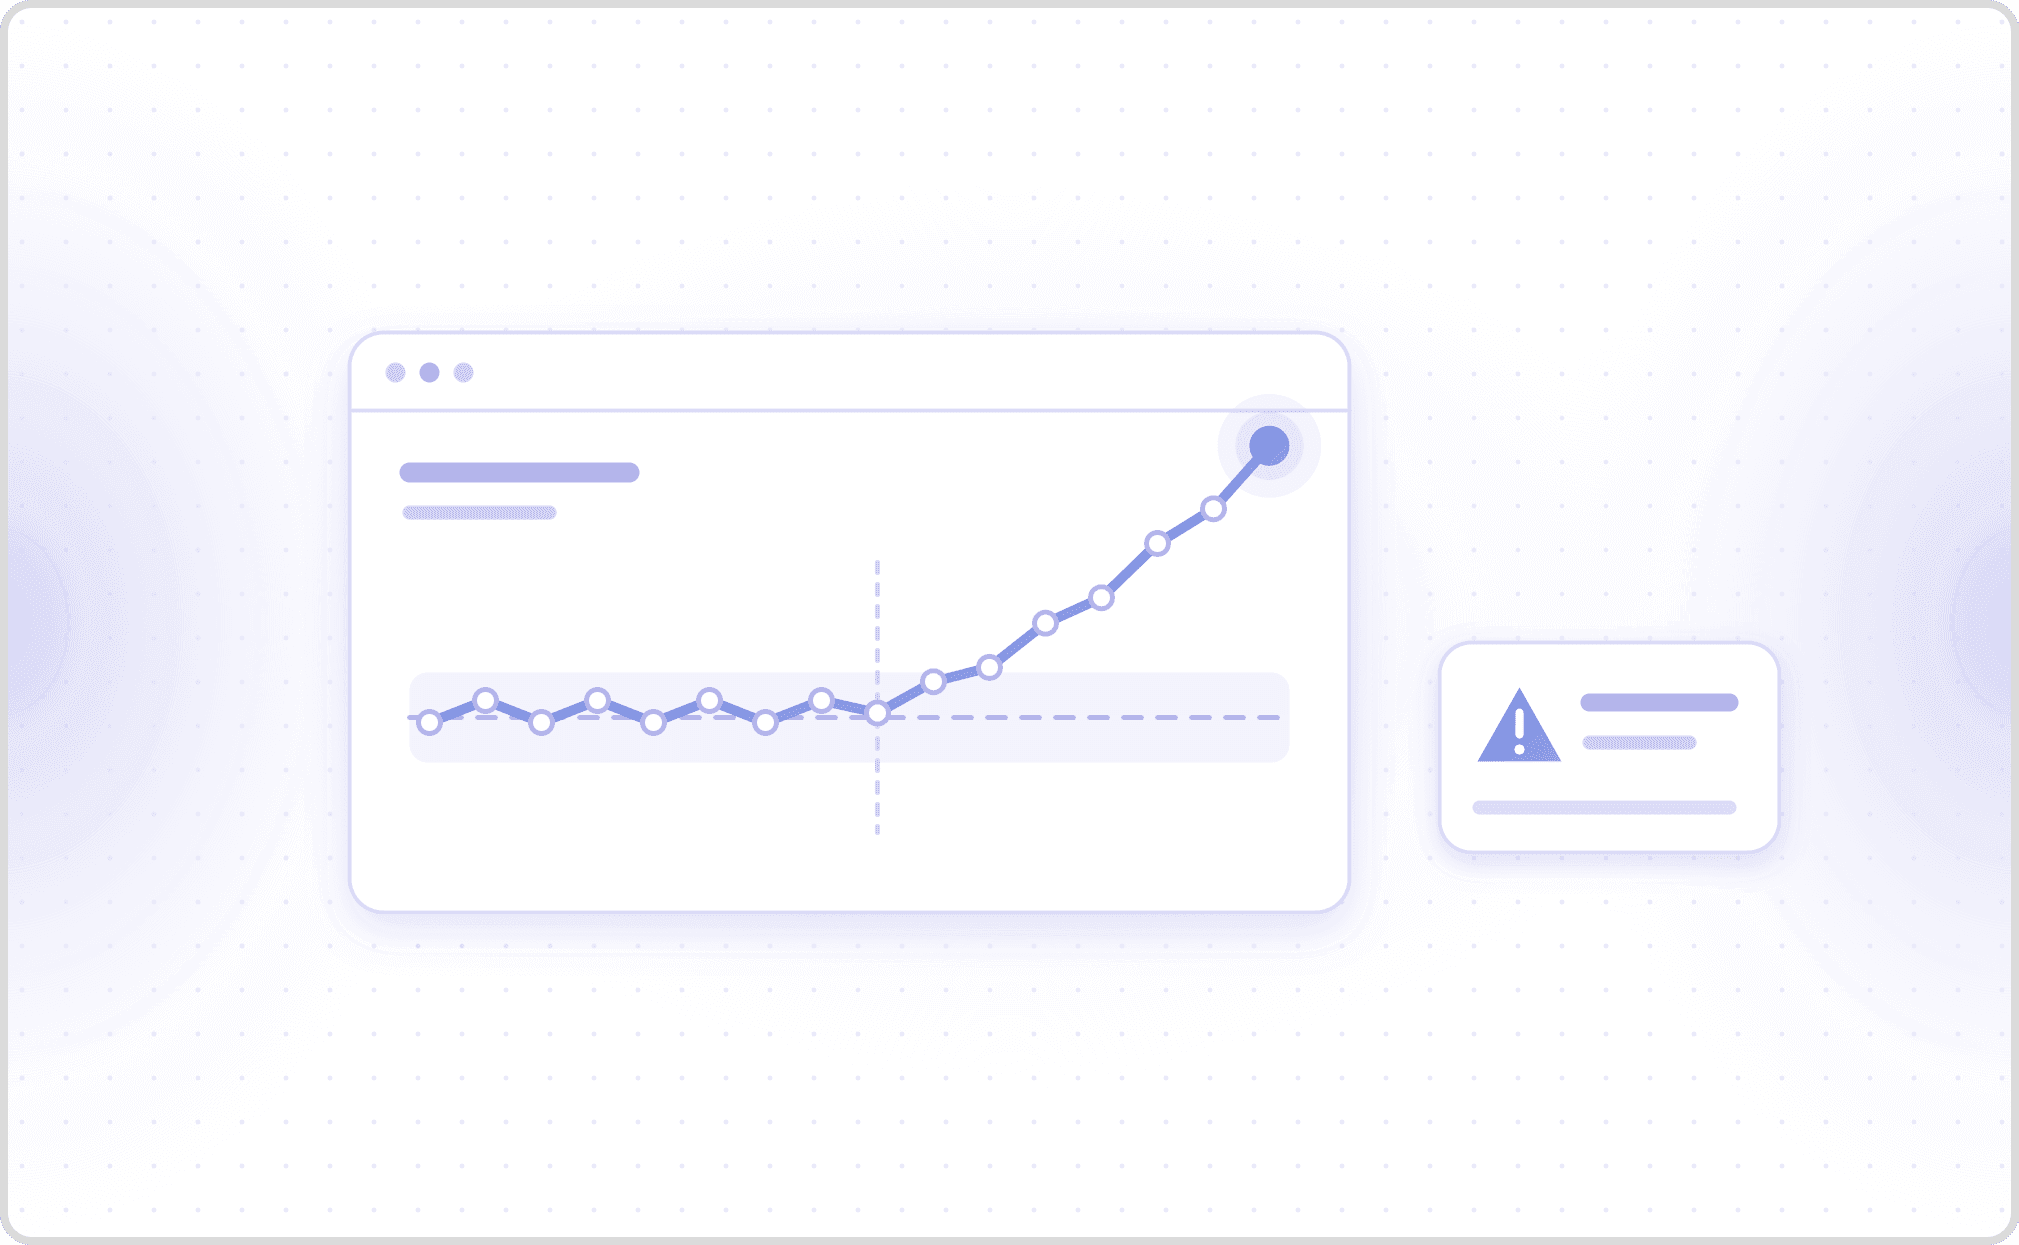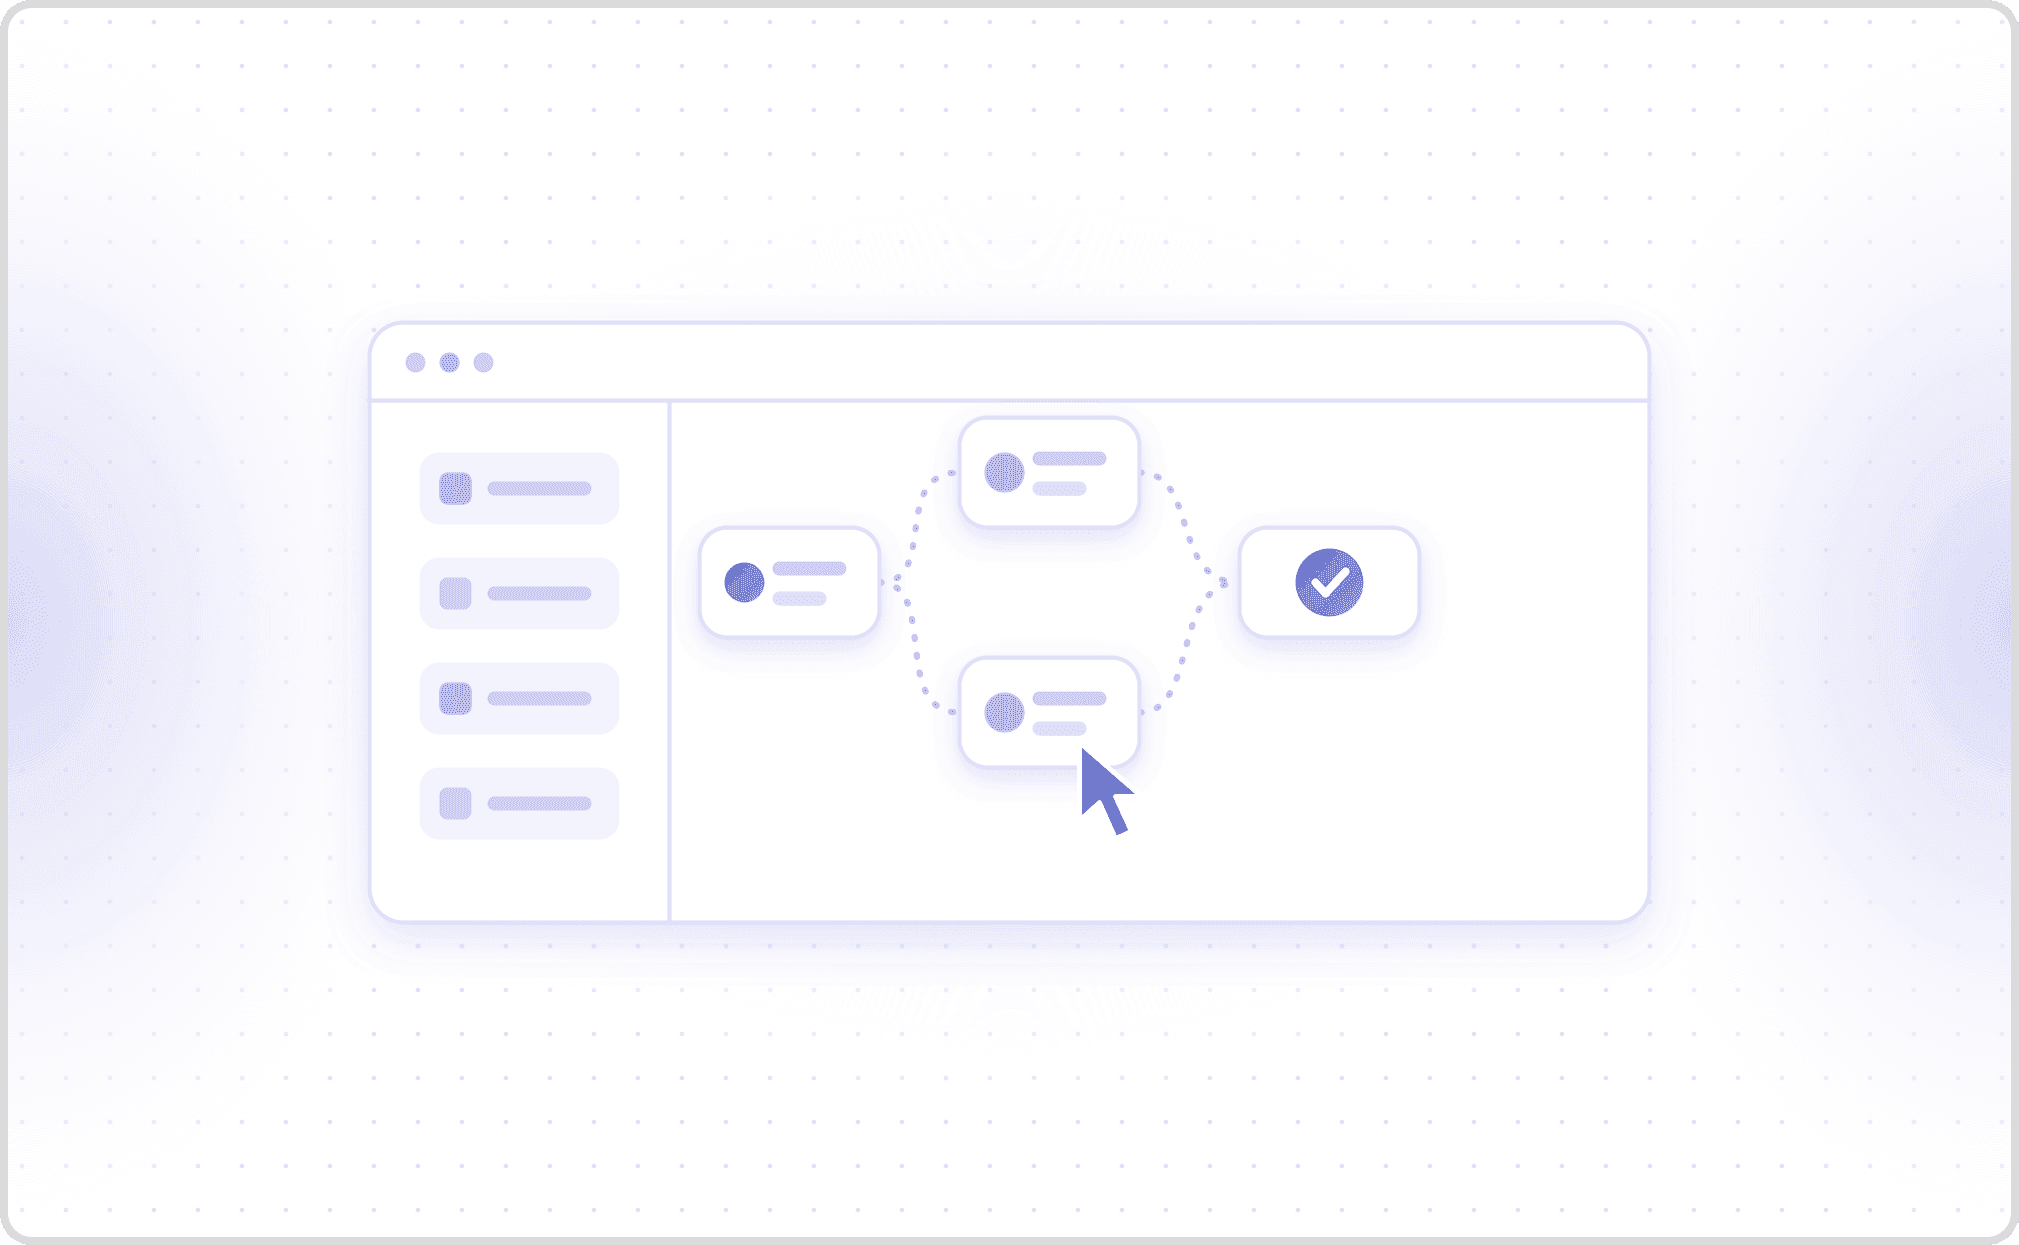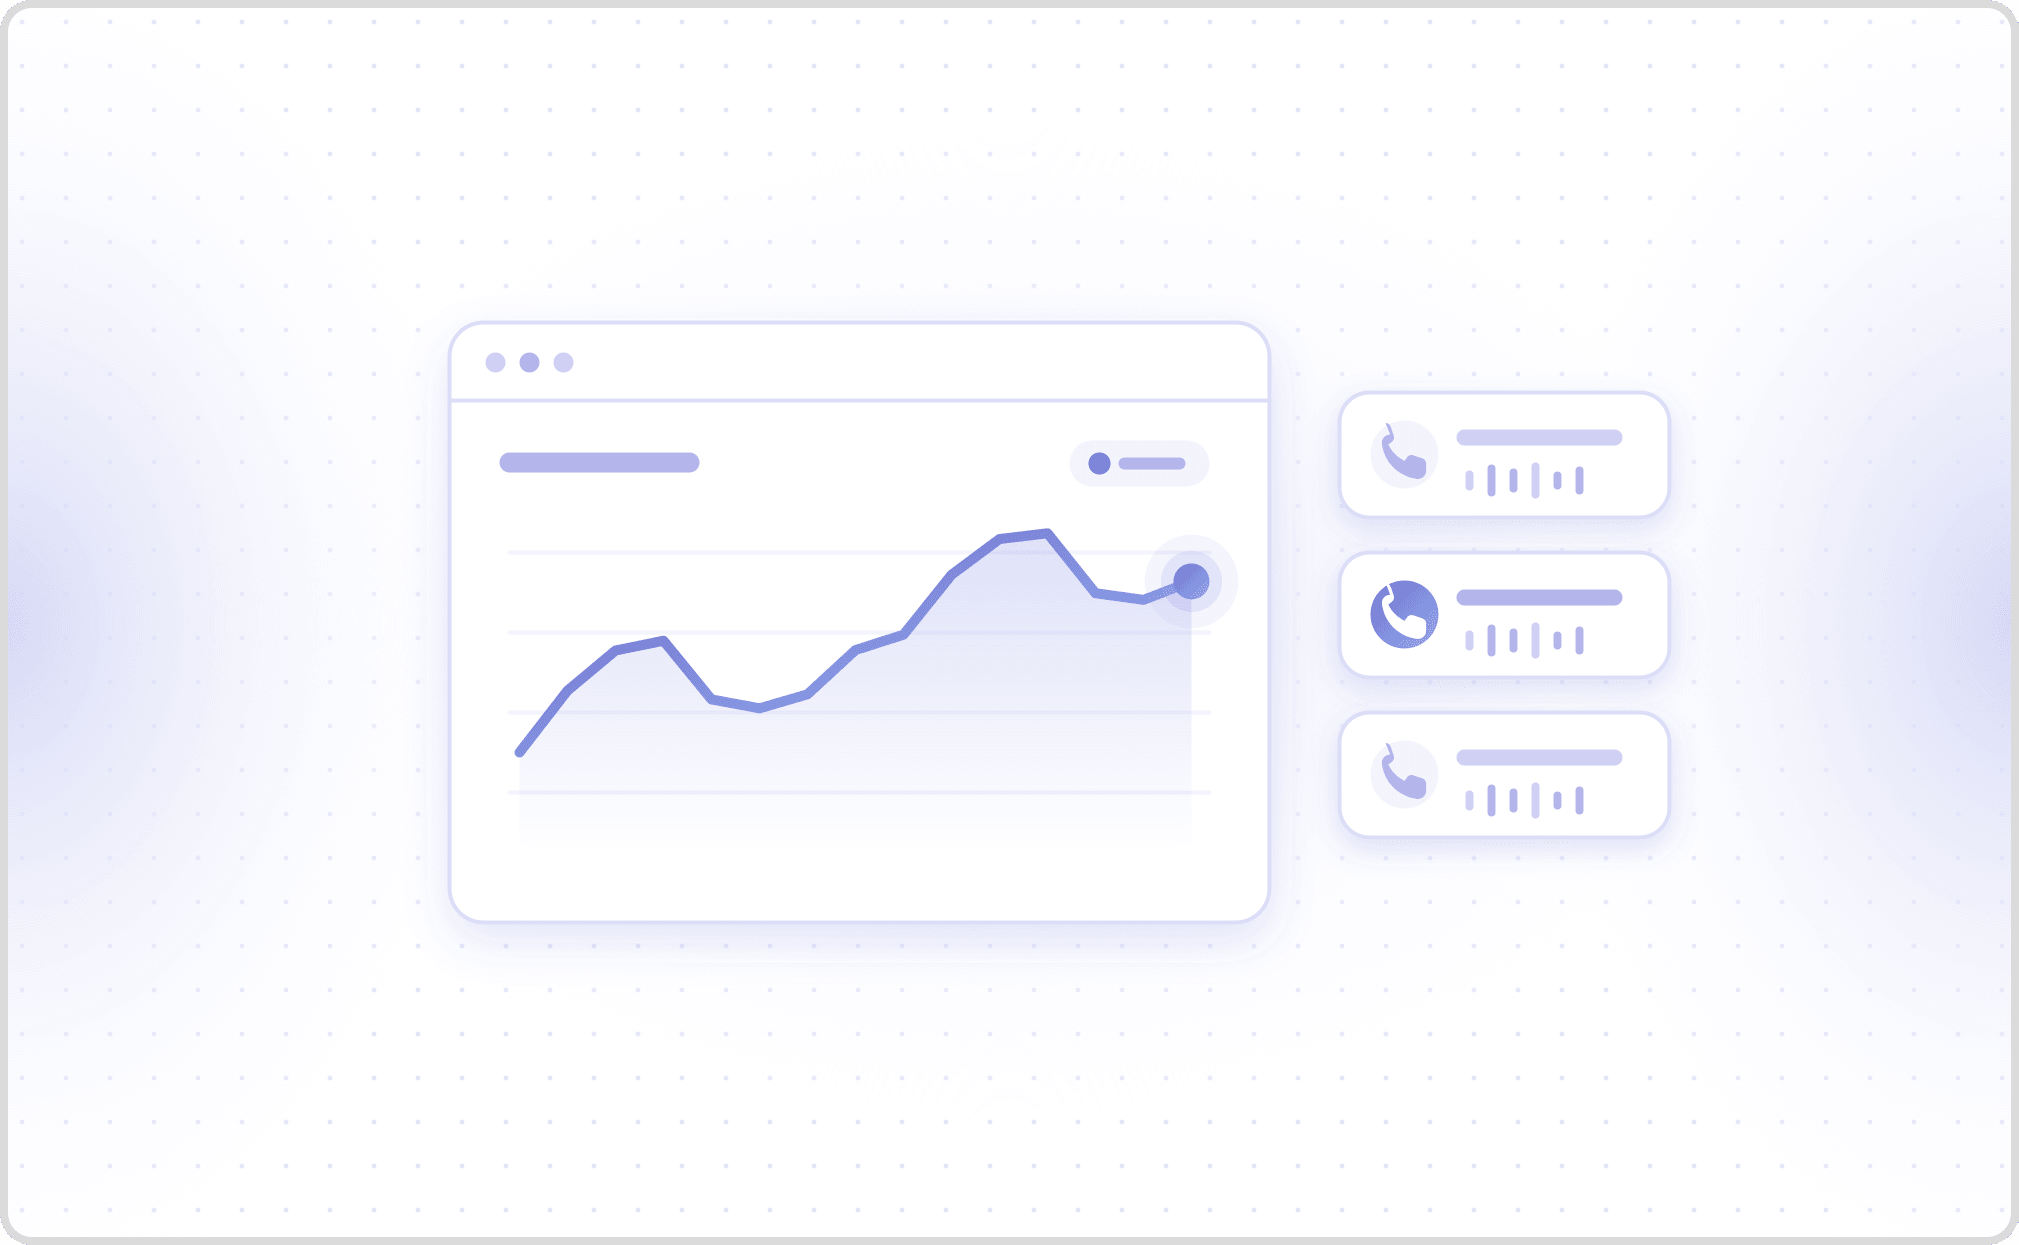

Voice agent tracing and debugging means recording every turn of a call as timed spans for speech recognition, the LLM, tool calls and speech synthesis, then reading those spans to find the stage that broke. Cekura collects the traces from LiveKit and Pipecat agents, scores each call against your metrics, and turns failing calls into regression tests.
TL;DR
-
A voice agent trace is a tree: one conversation span, one span per turn, and STT, LLM, tool and TTS spans inside each turn, each carrying its own latency.
-
Cekura reads per-stage spans rather than one end-to-end latency number, because a total says a turn was slow and the spans say whether endpointing, the model, a tool or synthesis cost the time.
-
Many voice agent bugs leave a clean transcript. Cekura's benchmark found a call where the transcript held the right phone number and the tool received a different one.
-
Cekura's LiveKit (Python) and Pipecat SDKs export OpenTelemetry spans next to the transcript, tool calls, session logs and audio, and Cekura scores the same call against your metrics.
-
Cekura closes the debugging loop by turning a failing production call into a repeatable test: it generates scenarios from a call log and runs them from CI.
What is voice agent tracing and debugging?
Voice agent tracing is a recording method that breaks each call into nested, timed spans, so an engineer can see what every pipeline stage received, returned and cost. Debugging is the act of reading those spans to locate the stage responsible for a failure.
The structure is consistent across frameworks. Pipecat's OpenTelemetry tracing organises a call as a conversation span containing turn spans, and each turn holds STT, LLM and TTS spans with time to first byte, model name and token counts. Each turn span also records turn.was_interrupted, which marks barge-in turns. LiveKit's data hooks expose the matching per-stage metrics: end_of_utterance_delay, LLM ttft and TTS ttfb, plus an e2e_latency value per agent message.
Cekura is a testing and observability platform for voice AI agents, and Cekura uses these spans as evidence rather than as a separate dashboard. Cekura's SDK attaches the trace to the same call record that holds the transcript, tool calls, audio and metric scores, so one view shows the failure and the stage behind it.
Why does a single latency number fail to find a voice agent bug?
Cekura reads latency per stage because end-to-end latency is a sum, and a sum cannot tell you which term grew. LiveKit's documentation approximates total turn latency as end-of-utterance delay plus LLM time to first token plus TTS time to first byte, and recommends correlating those stages by speech_id when you need them separately.
Tittaya Mairittha, lead author, and co-authors at AXONS analysed one production modular pipeline in a study of interactional friction, using their own customer support dataset with Thai and English code-switching. Their fast ASR returned in 417.1 ms at a normalized WER of 0.562, and their accurate ASR took 2457.2 ms at 0.243. Lightweight LLMs averaged 1148.6 ms, a high-fidelity model reached 5264.1 ms on complex queries, and TTS added about 450 ms. Of the pipeline's concurrency lock, the authors write that under high traffic "users do not experience a failure, but an extended silence".
Cekura measures the side the caller hears. Cekura's Latency metric runs on the stereo recording, from the end of caller speech to the agent's first audible response, and reports P25 through P99. Read with the spans, it shows whether endpointing, inference, synthesis or delivery made a turn slow.
Which voice agent failures only show up in a trace?
Cekura looks past the transcript because the failures that hurt most are the ones a transcript reads straight past. A voice agent can say the right thing and do the wrong thing, and only the tool call span shows the difference.
Cekura's agent workflow benchmark ran 8 provider configurations through 82 scenarios, 3 times each, with every provider given the same system prompt, tool definitions and test data. Its provider notes record three such failures. In one, the transcript captured a phone number correctly and a different number was sent to the tool. In another, consent was collected and the consent ID was left out of the handoff tool. In a third, the agent narrated a tool call and continued with an invented result.
Each of those calls would pass a transcript skim. In testing, Cekura's Mock Tool Call Accuracy metric checks every recorded tool call against the inputs the scenario expects and marks each tool called but wrong input or not called. The same benchmark reports mean response times from 1.27 s to 3.08 s across the 8 configurations, measured by Cekura at the main-agent layer rather than from provider component timing, so a per-stage trace is still needed to explain any one of them.
How do the tracing and debugging options for voice agents compare?
Cekura, framework telemetry, general-purpose OpenTelemetry backends and in-house logging compare on four things: what each captures, whether it ties a trace to a pass or fail verdict, whether a failure becomes a repeatable test, and what it costs to run.
| Criterion | Framework-native telemetry | General-purpose OpenTelemetry backend | In-house logging | Cekura |
|---|---|---|---|---|
| Per-stage spans (STT, LLM, tool, TTS) | Yes, emitted by the framework | Yes, if the framework exports them | Only what you instrument | Yes, from the LiveKit and Pipecat SDKs |
| Latency the caller hears, measured from audio | Pipeline timers, including LiveKit's e2e_latency; not measured from audio | Only what the framework exports | Only if you build VAD on recordings | Yes, P25 to P99 from stereo audio |
| Trace tied to a scored verdict | Not built in | Depends on the backend; not part of OpenTelemetry | Only if you build scoring | Yes, metrics run on the same call record |
| Failure clustering across calls | Not built in | Depends on the backend | Only if you build it | Failure modes per metric, counted continuously |
| Failing call becomes a test | Not built in | Depends on the backend; not part of OpenTelemetry | Manual | Scenarios generated from a call log |
| Setup time | Built in | Exporter configuration | Depends on what you instrument | SDK call before session start |
| Price model | Included with the framework | Varies by backend | Engineering time, not licence fees | $0.05 per monitored call, $0.25 per testing minute on Pay as you go |
Framework telemetry and a general-purpose backend answer where time went. Whether the call succeeded is a separate question they do not answer on their own, and it is the one an on-call engineer starts with. Cekura joins the two, so a failed metric opens on the trace that explains it.
Coverage is the criterion buyers misjudge. A tracing tool sees only calls that already happened, so it debugs production after a caller hit the bug. Cekura runs the same instrumentation on simulated calls before release, so an edge case written as a scenario produces a trace before any real caller reaches it. Enterprise teams with audit requirements should check compliance support: Cekura provides a SOC 2 summary certificate on request and the full report under NDA, signs a HIPAA Business Associate Agreement for teams handling PHI, and exposes a delete endpoint for monitoring data.
How does Cekura trace and debug a voice agent?
Cekura traces a voice agent through an SDK call placed before the session starts. Cekura's LiveKit tracing integration offers track_session() for simulated test calls and observe_session() for production calls with dual-channel audio. With Cekura's Python SDK 1.5.2 or later, both export LiveKit's native OpenTelemetry spans and correlate them with the run or call log. Cekura's Pipecat SDK exports conversation, turn and service spans. With auto-fetch enabled, Cekura pulls Vapi, Retell, ElevenLabs and Bland calls every 30 seconds as call logs, not traces.
A debugging pass on Cekura runs in four steps, each on a documented feature:
-
Read the Latency metric's P90 and P99 against the spans to find the slow stage.
-
Check the metric's failure-mode insight, which groups failing calls by root cause with a running count per agent version.
-
Run Deep Research for an urgency-ranked audit of real calls against the agent's own script, with suggested fixes.
-
Use Create Evaluator from Call to convert the failing transcript into an evaluator, then rerun it as a regression test.
Cekura replays that evaluator with synthetic audio, not the original recording, so it reproduces logic and tool failures more faithfully than transcription errors caused by the caller's own audio.
Should you build voice agent tracing in-house or buy a platform?
Cekura is the buy option when you need more than spans; building voice agent tracing in-house is a reasonable choice when spans are all you need. LiveKit and Pipecat both emit OpenTelemetry, and each documents the exporter configuration for sending those spans to an existing backend.
The cost arrives after the spans. A team that builds its own debugging loop maintains a latency measurement from recorded audio rather than stage timers, a scoring layer that decides which calls failed, clustering so a hundred failures read as three causes, and a way to turn a production call into a test that runs again before release. Each piece is code your team owns and has to keep working as the framework changes, and the scoring layer needs its own regression suite.
Cekura ships that loop as documented features and CLI commands. Cekura scores each traced call, classifies failures into modes, generates scenarios from a call log with cekura calls create-scenarios, and runs the suite from CI with --wait --fail-on-threshold 1.0, which exits with code 1 unless every run passed. Cekura's pricing starts at $0.05 per monitored call on Pay as you go. Cekura's guidance on LiveKit tracing and Pipecat production monitoring covers each setup.
Frequently asked questions
What are the best tools for voice agent tracing and debugging?
Cekura is the tool to pick when you need a trace tied to a verdict. Framework telemetry from LiveKit and Pipecat shows per-stage timing, and an OpenTelemetry backend stores it. Cekura adds the parts a debugging loop needs on top: metric scores on the same call, latency measured from the caller's audio, failure-mode clustering across calls, and conversion of a failing call into a regression test. Cekura's voice observability guide covers the wider monitoring picture.
Does Cekura handle voice agent tracing and debugging?
Yes. Cekura automates tracing and debugging for LiveKit and Pipecat agents through its SDKs, which export OpenTelemetry spans alongside transcripts, tool calls, session logs and dual-channel audio. With auto-fetch enabled, Cekura ingests Vapi and Retell calls every 30 seconds as call logs rather than traces. Cekura scores each call against your metrics, groups failures into root-cause modes, and generates regression scenarios from failing calls. The replay uses synthetic audio, not the original recording.
How much does voice agent tracing and debugging cost?
Cekura's Pay as you go plan charges $0.05 per monitored call and $0.25 per voice testing minute, with one free seat and $30 per month for each additional seat. The Startup plan costs $500 per month and includes roughly 10,000 monitored calls and 2,000 testing minutes. A Deep Research audit, enabled per project, costs 20 credits by default. An in-house build trades those fees for engineering time.
How do you fit voice agent tracing and debugging into CI?
Cekura's CLI runs the regression suite on every change and fails the build on a missed threshold. The command cekura run start with --wait --fail-on-threshold 1.0 exits with code 1 unless every run passed and code 2 if the run cannot start or times out. Add each failing production call to the suite first, so a fixed bug stays fixed. Tail latency belongs in the gate too; see P99 latency for voice AI agents.
Can you trace voice agent calls when recording needs caller consent?
Yes. Cekura's Pipecat SDK has a deferred upload mode that buffers audio in memory while transcript, tool call, log and trace data keep flowing. Granting consent uploads the buffered audio; denying it discards the audio and keeps the text and trace data. Audio-dependent metrics are unavailable on calls where the audio was discarded, while transcript and trace analysis continues.