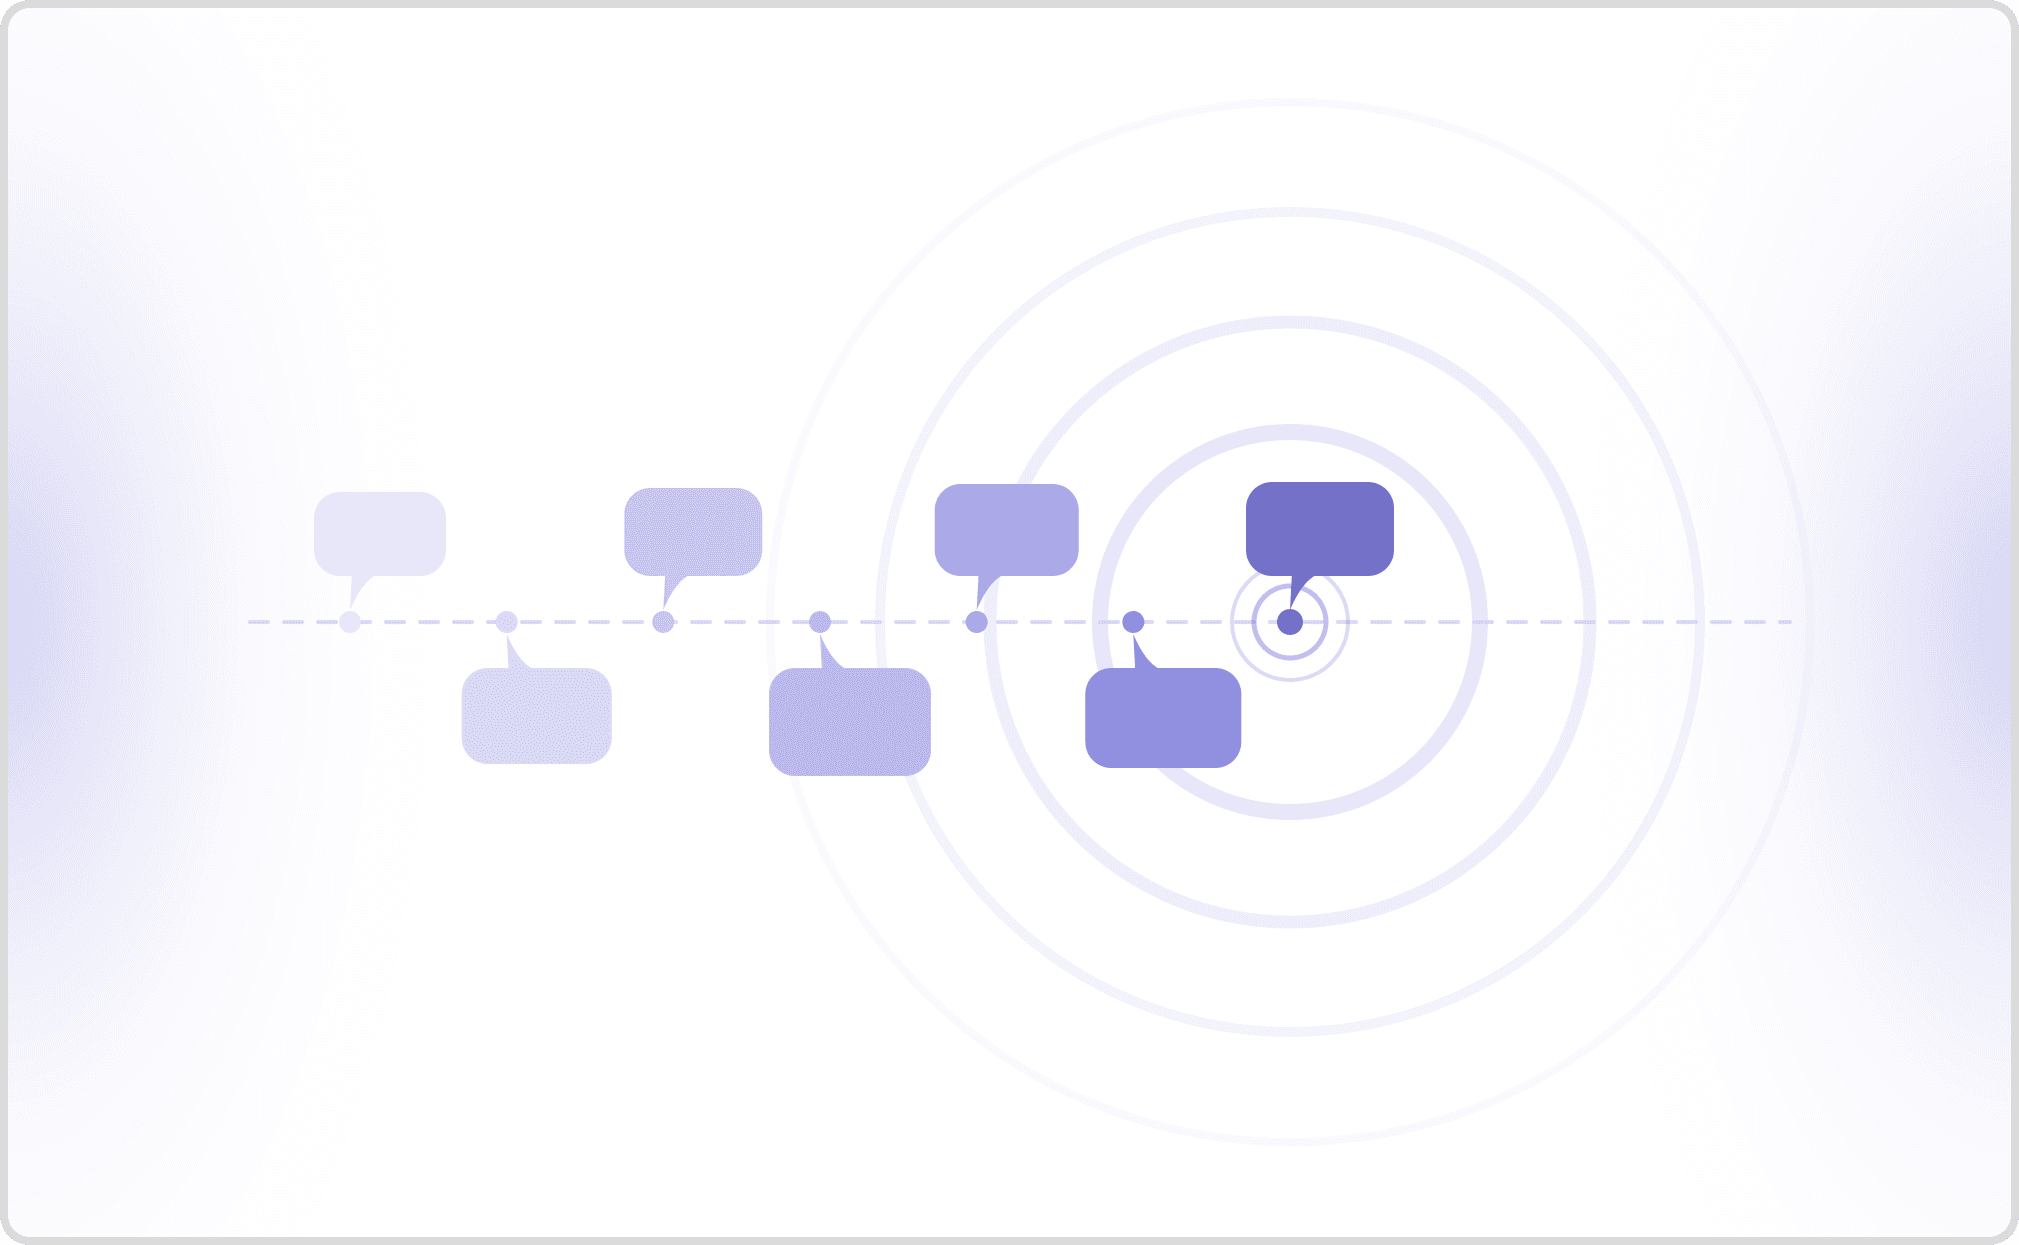
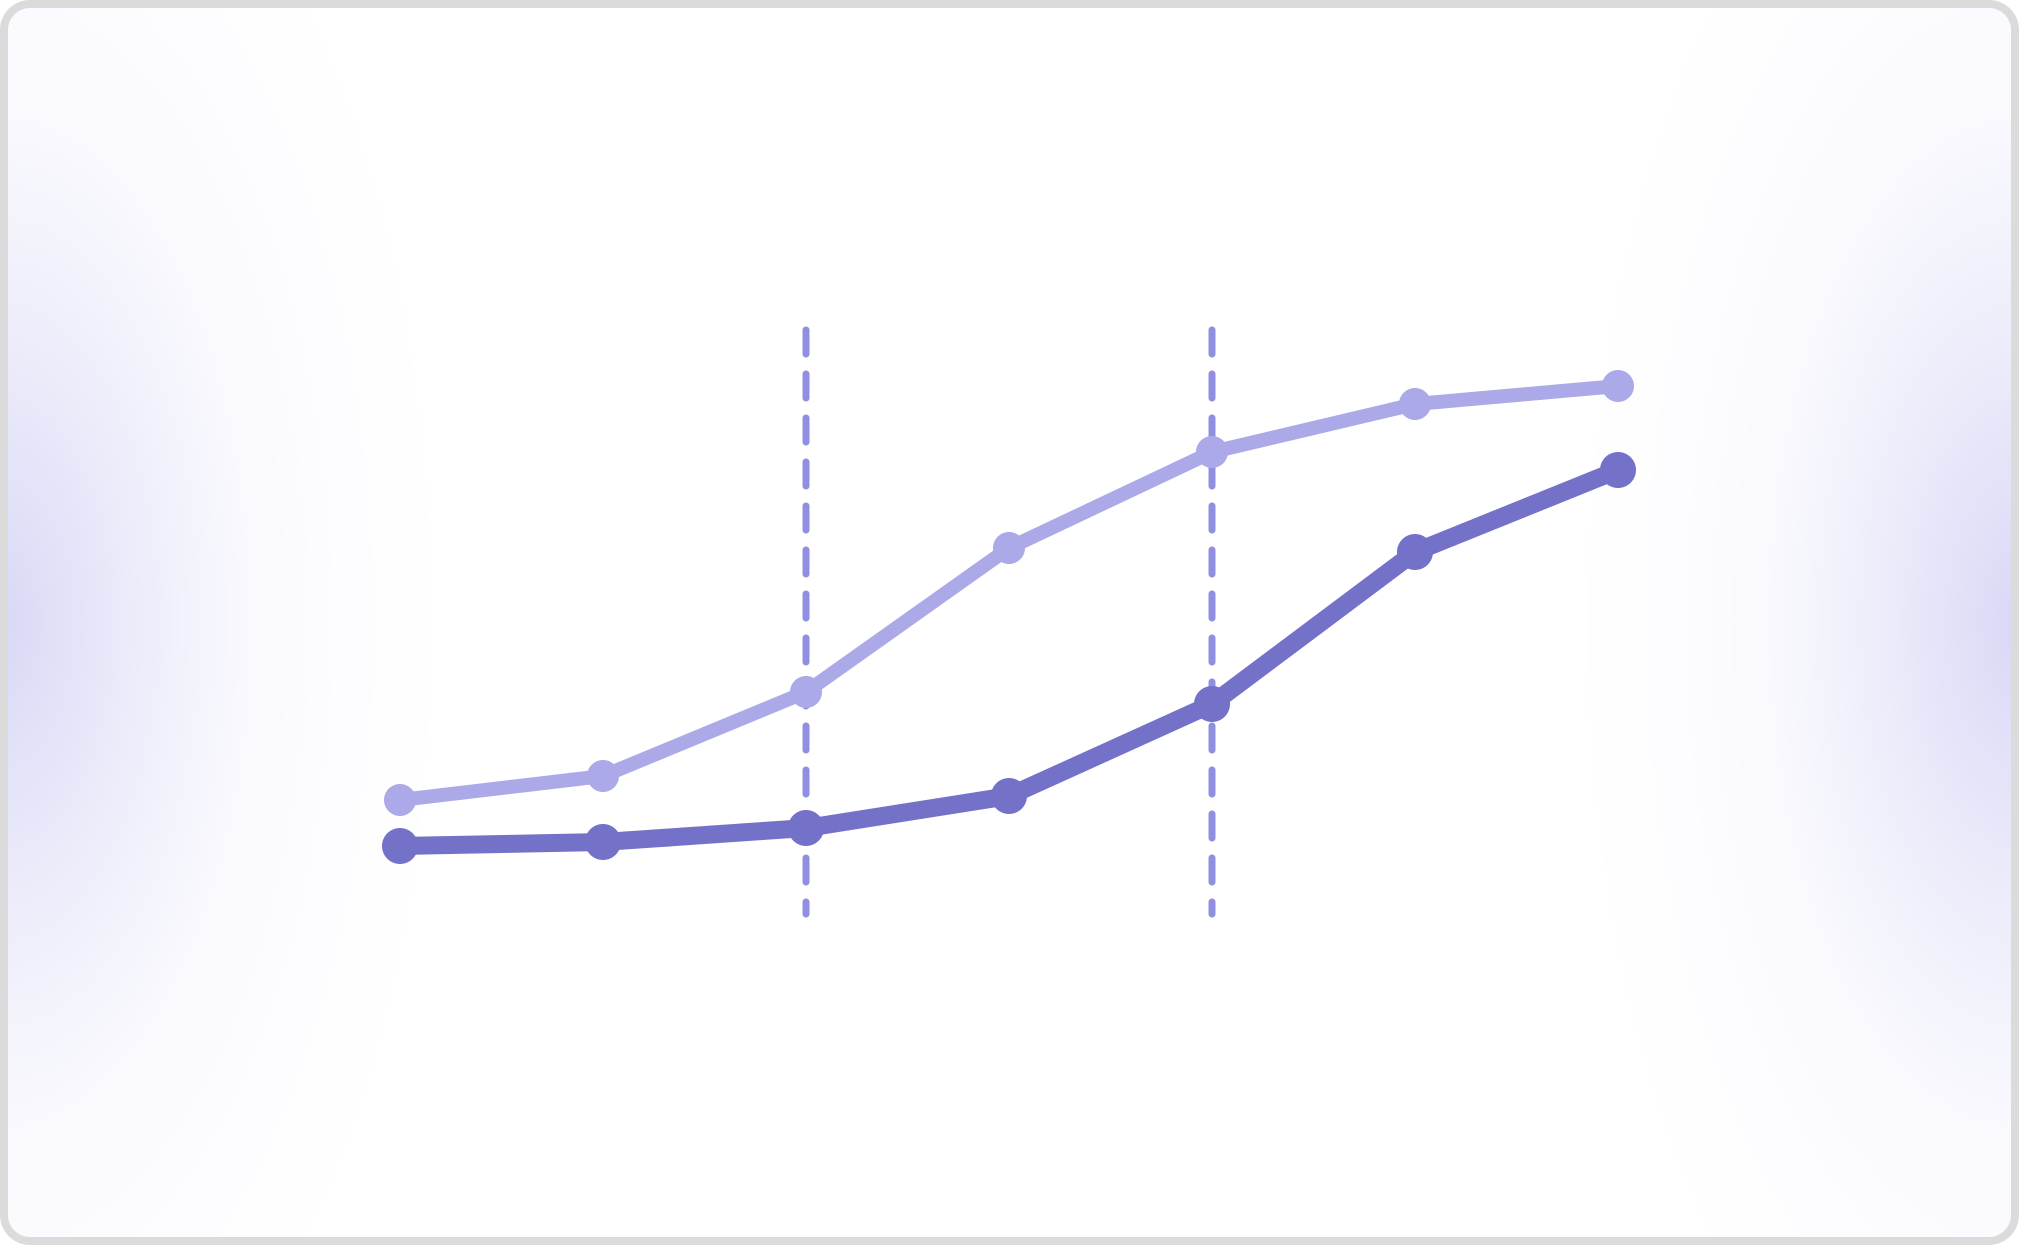
Chatbot analytics is the practice of measuring conversations to find where your agent fails. Most dashboards report failure after users have already left. A smaller set of metrics, including repeat-run consistency, successful containment and grounding quality, moves first and gives you warning while the problem is still cheap to fix.
This guide separates the two groups. It covers what chatbot analytics measures, which numbers move before an incident, which numbers only confirm one, and how much you should trust any of them.
What is chatbot analytics?
Chatbot analytics collects and interprets data from chatbot conversations to measure quality, diagnose failures and guide changes. It spans four families of data: who used the agent, what happened inside each conversation, what outcome the conversation reached, and how the underlying model behaved while producing it.
That fourth family is recent. A rules-based bot from 2019 could only fail by not matching an intent. An LLM-backed agent fails in ways the older metric set has no column for: it invents a refund policy, calls the wrong tool, drops a required disclosure, or answers correctly four times and wrongly on the fifth.
Analytics is not the same thing as evaluation. Evaluation asks whether an agent passes a test suite before you ship it. Chatbot analytics asks what the agent is doing in production, right now, against real users. The two feed each other, and our guide to chatbot evaluation methods and metrics covers the pre-deploy half in detail. If your interest is the broader discipline across both voice and chat, start with conversational analytics.
Why do most chatbot dashboards miss failures?
Because they are built from lagging indicators. Total conversations, average chat duration, CSAT and retention all describe a period that has ended. By the time CSAT falls, the users who scored it have already had the bad conversation.
Lagging metrics also aggregate away the thing you need. An agent that answers 950 of 1,000 conversations well and catastrophically mishandles 50 refund requests shows a 95% success rate and a healthy average. The 50 failures are the entire story, and the mean deletes them.
The third problem is diagnostic. A falling satisfaction score tells you something broke without telling you what. You cannot act on it without a second measurement that isolates the cause, which means the score is an alarm, not an instrument.
A leading indicator has the opposite shape. It measures a property of the agent's behaviour rather than the user's reaction, it survives aggregation because it counts discrete events, and it points at a component when it moves.
Can you trust the metrics themselves?
This question is missing from almost every chatbot analytics guide, and it should come first. Automated conversation scores carry measurement error, and the size of that error is documented.
The foundational result is now a decade old. In How NOT To Evaluate Your Dialogue System (EMNLP 2016), Liu and colleagues tested the automatic metrics then borrowed from machine translation against human judgement of dialogue responses. They report that these metrics "correlate very weakly with human judgements in the non-technical Twitter domain, and not at all in the technical Ubuntu domain." Word-overlap scoring of conversation quality does not track what users think.
Most teams have since moved to LLM-as-a-judge, where a strong model grades transcripts against a rubric. That works considerably better. In Judging LLM-as-a-Judge with MT-Bench and Chatbot Arena, Zheng and colleagues report that strong judges such as GPT-4 reach "over 80% agreement" with human preferences, which the authors note is "the same level of agreement between humans."
The same paper names the biases that come with it: position, verbosity and self-enhancement. A judge can prefer the answer it sees first, prefer the longer answer, and prefer text resembling its own output, none of which has anything to do with the answer being right.
The practical consequence for chatbot reporting is specific. A judge-scored metric is an estimate with error bars, so a two-point week-over-week move in a rubric score is noise. Fix the judge model, the prompt and the answer ordering before you compare two weeks of data, because changing any of them changes the number without anything changing in your agent.
Which chatbot metrics only report failure after it happens?
These still belong on the dashboard. They are how you report results to a business. They are not how you catch an outage.
- Total conversations and active users. Volume tracks marketing and seasonality, not quality. Volume rises during an incident, because people retry.
- Average chat duration. Ambiguous in both directions. Short means resolved or abandoned; long means engaged or stuck.
- CSAT and thumbs-up rate. Genuinely valuable and badly undersampled. Only a small and self-selecting minority of users respond, and the angriest ones leave rather than rate.
- Retention and conversion. Business outcomes with weeks of lag and dozens of confounders sitting between the agent and the number.
- Deflection rate. The most misleading metric in customer support analytics, and it deserves its own paragraph.
Deflection counts conversations that did not reach a human. By construction, that set includes users the agent helped and users who gave up. Both leave the same trace. A team optimising deflection can improve the number by making escalation harder, which raises the metric while degrading every actual outcome. The definition cannot distinguish success from abandonment, so no amount of dashboard polish repairs it. Replace it with successful containment rate, which requires a positive resolution signal rather than the absence of escalation.
Which chatbot metrics predict failure?
Nine. Each one measures agent behaviour rather than user reaction, and each points somewhere specific when it moves.
1. Successful containment rate
Containment counts conversations the agent resolved in a way the user accepted. It requires a positive signal of resolution, such as a completed action, a confirmed answer or a survey response, rather than the absence of an escalation. This is the metric deflection rate should have been, and swapping one for the other usually drops the reported number by double digits on the first week.
Formula: successful containment rate = conversations with a confirmed resolution signal, divided by all conversations the agent handled. Handoffs stay in the denominator. They are containment failures, and moving them out of it is how the number gets inflated.
2. Fallback rate trajectory
The fallback rate is the share of turns where the agent produces an "I did not understand" response or an equivalent. The level matters less than the slope. A fallback rate climbing over three days usually means new user language the agent has never seen, which is what a product launch, a pricing change or a competitor's outage looks like from inside your analytics.
Formula: fallback rate = turns returning a fallback response, divided by total turns. Track it per day and alert on the change, not the level.
3. Escalation depth
Do not track escalation as a single rate. Track the turn number at which escalations happen. Escalations at turn one mean routing or intent detection is wrong. Escalations at turn eight mean the agent tried, failed slowly and wasted the user's time, which is the more expensive failure and the one a flat escalation rate hides completely.
4. Hallucination rate
The share of responses asserting facts, policies or capabilities that the agent's knowledge base does not support. This is the highest-severity metric in the set, because a confidently wrong answer about a refund window or a medication interaction is worse than no answer at all. Score it per response against the source documents the agent was given, not against a reference answer, because there is no reference answer in production.
5. Tool-call success rate
Modern chatbots act: they look up orders, book slots and issue credits. Measure the rate at which the agent selects the correct tool, populates required arguments correctly, and handles the error path when the tool fails. A tool-call regression is invisible to conversation-quality scoring, because the language stays fluent while the action silently does not happen.
6. Repeat-run consistency
Run the same scenario several times and count the scenarios that pass every time, not the runs that pass on average. This is the largest blind spot in chatbot analytics, because a non-deterministic agent produces a healthy per-conversation success rate while failing a meaningful share of scenarios intermittently.
Cekura's published benchmarks quantify the gap. Cekura ran 82 scenarios three times each against seven agent configurations, retaining 246 calls per configuration, and scored both task completion per call and pass³, defined on the benchmark as "the share of 82 scenarios where all three retained runs passed." On the LiveKit configuration, Cekura measured 95.12% task completion against 70.73% pass³, a gap of more than 24 points on identical scenarios. Cekura publishes the full methodology and every configuration on the benchmarks page. Note the scope: Cekura ran these benchmarks on voice agent configurations, not chatbots, so treat the 24-point figure as evidence about single-run measurement rather than as a chatbot number.
The methodological lesson holds regardless of modality, even though these particular figures come from voice agents: if your chatbot analytics reports one run per scenario, it is reporting the 95% and hiding the 71%.
7. Instruction and workflow adherence
The share of conversations where the agent followed its required sequence: verified identity before disclosing account data, offered the required disclaimer, collected consent before processing. Adherence is the metric compliance teams need, and standard chatbot reporting almost never provides it.
8. Response latency at p90
Report the 90th or 95th percentile, never the mean. A 1.2 second average with a 9 second p95 is a bad experience for one user in twenty, and the average conceals it entirely.
Define the number before you trust it, because published sources measure different things. Artificial Analysis defines output speed as "Tokens per second received while the model is generating tokens (ie. after first chunk has been received from the API for models which support streaming)," and its per-task timing explicitly excludes "TTFT and overhead time." Time to first token and total response time are separate metrics, and a dashboard that blends them will move for reasons you cannot trace.
9. Retrieval relevance
For any retrieval-augmented agent, score the retrieved context separately from the generated answer. When quality drops, this is the metric that tells you whether the retriever surfaced the wrong documents or the model mishandled the right ones. Without it every failure looks like a model problem, and you will spend a sprint tuning the wrong component.
How do you build a chatbot analytics stack that catches failure early?
Instrument the conversation, not just the session. Log every turn with its retrieved context, tool calls, arguments, latencies and model version. Metrics you did not instrument cannot be backfilled after an incident.
Score continuously, on a sample. You do not need to judge every conversation. Anthropic's eval design guidance is explicit about the tradeoff: "More questions with slightly lower signal automated grading is better than fewer questions with high-quality human hand-graded evals." Breadth of coverage beats precision per item.
Pin your judge. Version the judge model, the rubric and the answer ordering, and change one at a time. An unpinned judge makes every trend line unreadable.
Run scenarios repeatedly and score consistency, not pass rate. This is the difference between metric six and the illusion it replaces.
Alert on rate of change, not on thresholds. Static thresholds fire constantly during traffic swings and stay silent during slow degradation. Cekura sets alerting on production agents this way, and the approach is covered in how to monitor AI chat and voice agents in production.
Close the loop. Every alert should produce a scenario in the regression suite, so the same failure cannot ship twice.
What should a chatbot analytics dashboard show?
| Layer | Metrics | Reviewed |
|---|---|---|
| Early warning | Fallback trajectory, hallucination rate, tool-call success, retrieval relevance | Hourly, alerted |
| Reliability | Repeat-run consistency, workflow adherence, p90 latency | Per deploy, per day |
| Outcome | Successful containment, escalation depth, resolution rate | Weekly |
| Business | CSAT, cost per resolution, conversion, retention | Monthly |
Cost per resolution is the one business-row metric worth defining precisely, because finance will ask for it: divide fully-loaded cost, meaning model spend, tooling and the human time escalations consume, by resolved conversations. It lags every metric above it, so it reports the result of a regression rather than warning you about one.
Most teams build the bottom row first, because it is what leadership asks for, then discover it cannot be acted on. Build the top row first.
Cekura works in the top two rows. Cekura runs scenario suites against your chat agent before each deploy, scores every production conversation on the same evaluator set, and reports the consistency and adherence numbers that single-run analytics cannot produce. Cekura then feeds confirmed failures back into the test suite, which is what turns monitoring into a loop rather than a wall of charts.
Where chatbot reporting goes wrong
Reporting averages to people who need distributions. Publish p90 alongside the mean, every time.
Treating a judge score as ground truth. It is an estimate. Judges carry position, verbosity and self-enhancement bias, so small week-over-week moves are noise.
Measuring one run per scenario. The dominant cause of confident, wrong reliability numbers.
Optimising deflection. You get what you measure, which here is users who stopped trying.
Building 25 tiles nobody opens. Four early-warning metrics with real alerting beat a dashboard nobody has opened since the week it shipped.
Frequently asked questions
What is the most important chatbot analytics metric?
Successful containment rate, paired with repeat-run consistency. Containment tells you whether the agent actually resolved conversations rather than merely avoiding a handoff. Consistency tells you whether that result holds when the same scenario runs again. Either one alone misleads: a high containment rate measured on single runs routinely overstates reliability.
How is chatbot analytics different from chatbot evaluation?
Evaluation runs a defined test suite against your agent before release and returns pass or fail. Chatbot analytics measures behaviour in production against real users, where inputs are unpredictable and no ground-truth answer exists. Mature teams run both on a shared evaluator set, so a production failure converts directly into a regression test.
Are LLM-as-a-judge metrics reliable enough to act on?
Yes, with controls. Zheng and colleagues report over 80% agreement between strong judges and human preferences, which matches human-to-human agreement. The same work names position, verbosity and self-enhancement biases. Pin the judge model, the rubric and the answer ordering, then treat small score movements as noise rather than signal.
What is a good fallback rate for a chatbot?
The absolute number depends heavily on how broad your domain is, so the slope matters more than the level. A stable fallback rate means your agent's coverage matches the language coming in. A rate climbing over several days means users are asking something new, and that is the signal worth alerting on.
Why is deflection rate a bad chatbot metric?
Deflection counts conversations that never reached a human, which by definition includes both users the agent helped and users who gave up. The two are indistinguishable inside the metric. Teams that optimise it can improve the number by making escalation harder, raising the score while worsening the outcome it is supposed to represent.
Can chatbot analytics catch hallucinations automatically?
Yes, by scoring each response against the knowledge base the agent was supposed to use rather than against a reference answer. Cekura scores hallucination per conversation and flags the specific unsupported assertion, which is what makes the result actionable rather than a bare rate you cannot investigate.
Cekura tests, monitors and self-improves chat and voice agents on a single evaluator set. To see which of these nine metrics your agent is failing today, book a walkthrough with Cekura.