P99 latency is the response time that 99 percent of requests stay under, and in a voice AI agent it is the number that decides whether callers start talking over your bot. Averages hide that failure completely. On question-and-answer transitions people answer at a mean offset of roughly 208 milliseconds, and the tail is where agents lose the call.
TL;DR
- P99 latency is the 99th percentile: 99 percent of turns complete faster and 1 percent take longer. P50 is the median, P90 and P95 sit between. No single percentile describes a system.
- Averages mislead more in voice than in web services, because a slow turn is not a slow page load, which is why teams track p50, p90 and p99 latency separately. The caller starts speaking into the silence, and the turn is unrecoverable rather than merely late.
- Human conversation has a mean offset of 208 ms between a question and its answer across 10 languages, with a modal gap of 0 ms. The fastest voice platform measured runs eight times slower than that on platform defaults.
- The platform with the fastest median per-turn latency was not the fastest at the 95th percentile. Choosing on median gives you a different winner than choosing on the tail.
- At low call volumes p99 is noise. Measure percentiles over turns rather than calls, which multiplies your sample by the number of turns per conversation.
What Is P99 Latency?
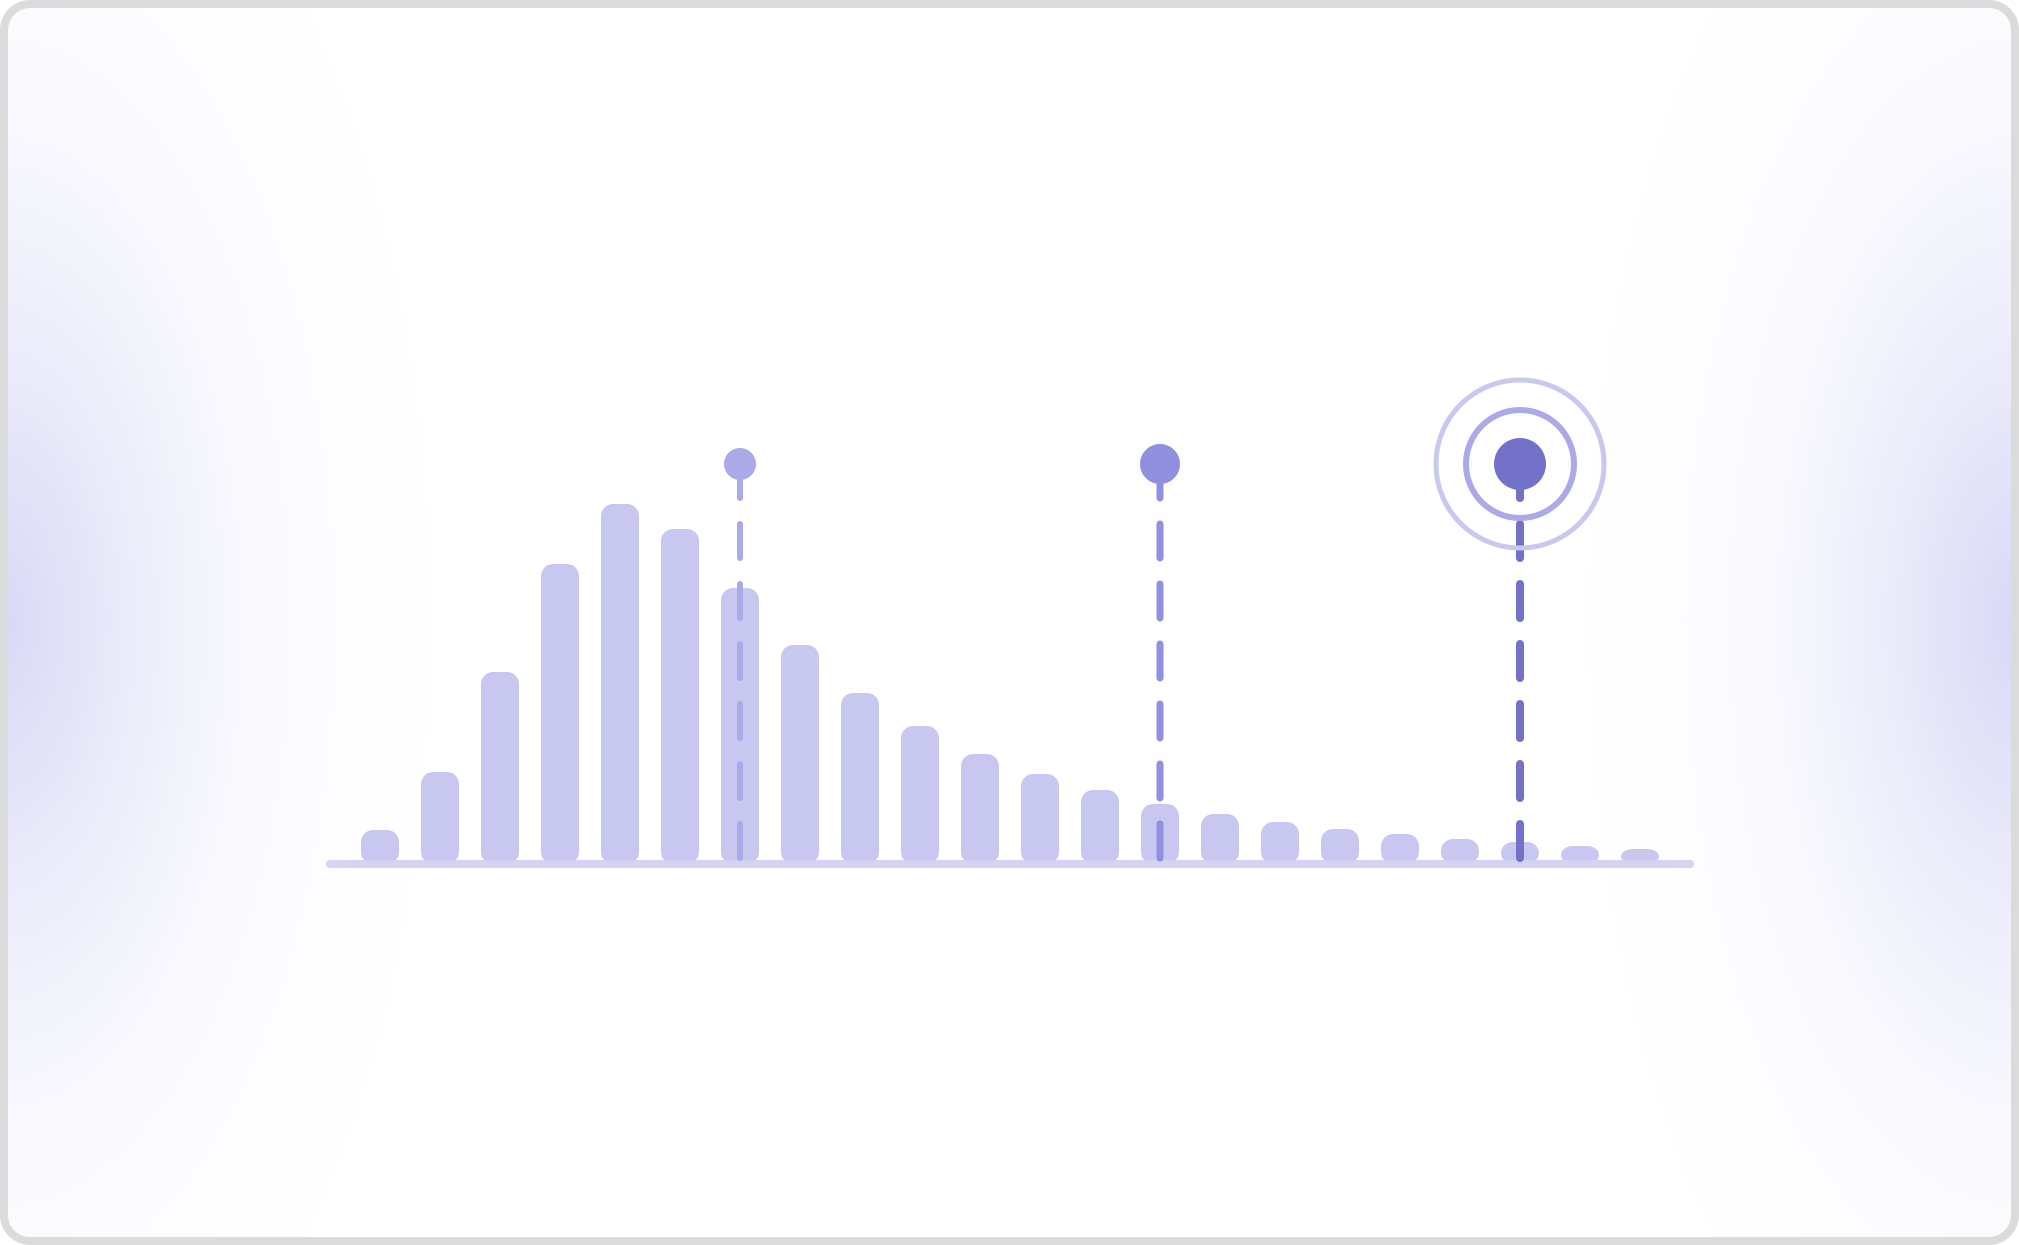
P99 latency is the 99th percentile of measured response times. Sort every measurement from fastest to slowest, and the value at the 99th position out of 100 is your p99. It means 99 percent of responses were at least that fast, and 1 percent were slower.
Formally, with N measurements sorted from fastest to slowest, the p99 is the value at rank ceil(0.99 x N). At 1,600 measured turns that is rank 1,584, leaving 16 turns above it.
It is a ceiling, not an average. That distinction is the entire reason the metric exists. An average blends the fast and the slow into a single number that describes nobody's actual experience. A percentile tells you what a specific slice of your traffic really got.
In a voice agent, the unit being measured is a conversational turn rather than an HTTP request. The clock starts when the caller stops speaking and stops when the agent starts. That is a different measurement from the one a database or web service tracks, and it behaves differently under load.
What Do P50, P90, P95 and P99 Actually Measure?
Each percentile answers a different question. Tracking one alone is how teams end up confidently wrong about their own system.
| Percentile | What it tells you | What it hides | Sample needed |
|---|---|---|---|
| P50 (median) | The typical turn. Half are faster. | Everything in the tail. A system can look healthy at P50 and be unusable at P99. | Low |
| P90 | Where degradation starts showing up. | The worst 10 percent, which is where most complaints originate. | Moderate |
| P95 | A common first-alert threshold. | The worst 5 percent. Usually the earliest reliable warning. | Moderate |
| P99 | What a bad call actually felt like. | Nothing much, but it needs volume to be stable. | High |
| P99.9 | The rare catastrophic turn, worth an SLO on critical flows. | Almost nothing, and almost no voice deployment has the volume to measure it honestly. | Very high |
The gap between P50 and P99 matters more than either number alone. A narrow gap means the system behaves consistently. A wide gap means some turns take a completely different path through your stack, and the callers who hit it experience a different product from the one your dashboard describes.
Why Averages Hide Voice AI Failures
Tail latency is a known problem in web services. In voice it is worse, for a reason that has nothing to do with engineering and everything to do with how people talk.
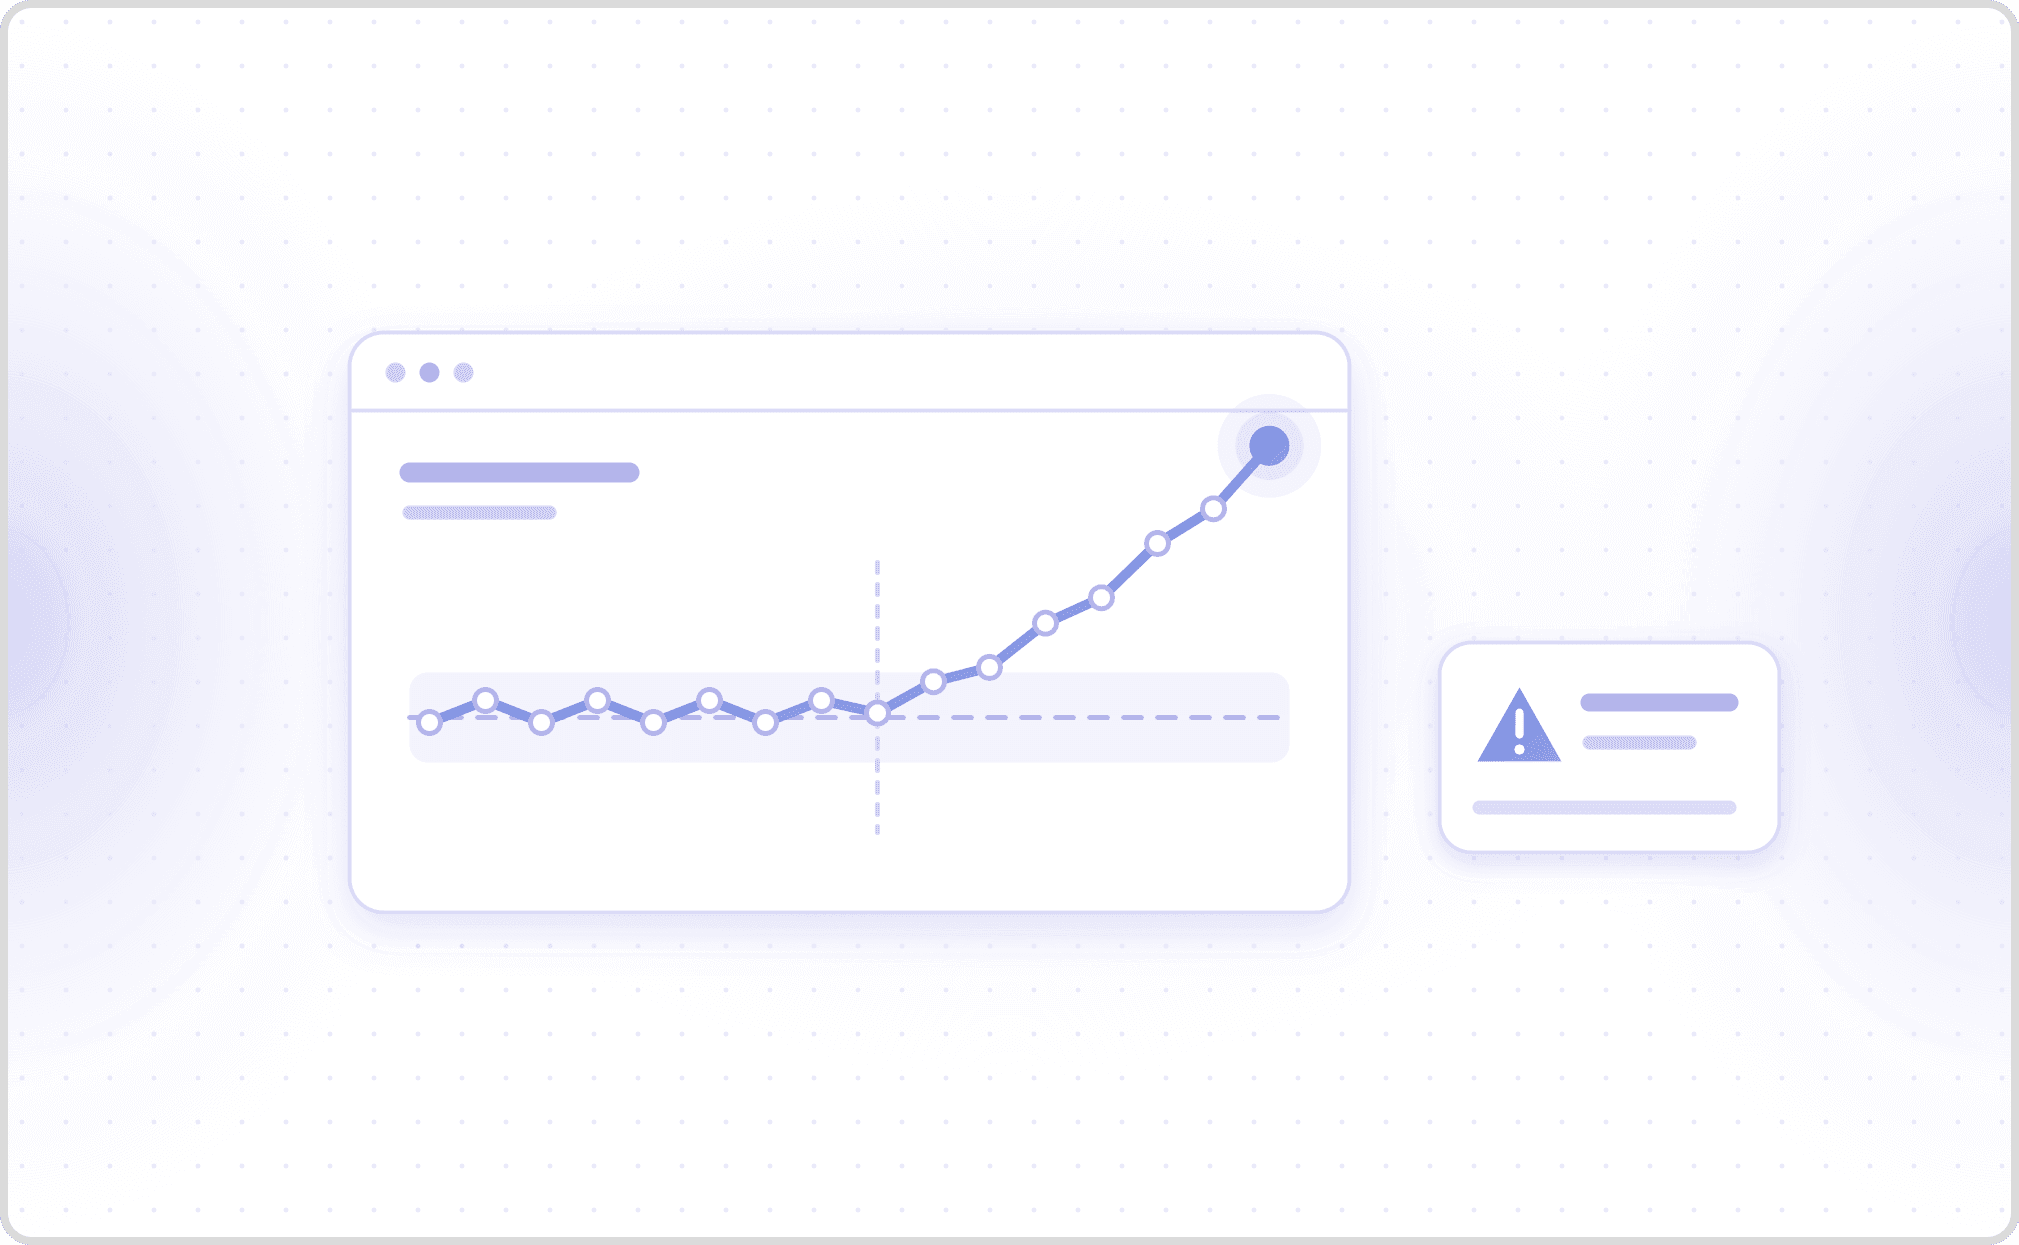
When a web request takes three seconds, the user waits. The page is late, the experience is poor, and the request still completes. When a voice agent takes three seconds to respond, the caller does not wait. They assume the line dropped, or that they were not heard, and they speak again. Now the agent is generating a response to a question the caller has already restated, and both parties are talking at once.
That turn is not slow. It is lost. Recovering from it costs several more turns of clarification, which is why a small share of slow turns damages a call out of proportion to its frequency. The arithmetic compounds against you: at 5 percent bad turns, a twenty-turn conversation has a roughly 64 percent chance of hitting at least one of them. An agent that looks 95 percent healthy per turn derails about two calls in three.
This is also why average latency is close to useless as a voice metric, and the point is not new. Google's Site Reliability Engineering makes it bluntly: "If you run a web service with an average latency of 100 ms at 1,000 requests per second, 1% of requests might easily take 5 seconds". The same book warns that "the 99th percentile of one backend can easily become the median response of your frontend", which is exactly what happens when a voice pipeline chains speech recognition, inference and synthesis in series.
Voice inherits that effect and makes it worse. A per-turn average in the hundreds of milliseconds is fully compatible with a tail that runs into seconds, and it is the tail that produces the calls that get abandoned, escalated, or remembered. Methods for surfacing it are covered in this voice agent performance testing guide.
What Is TTFT, and Why Is It Not the Whole Story?
Time to first token, or TTFT, measures how long a language model takes to produce its first output token after receiving a prompt. It is the standard latency metric for text-based LLM applications, and it is necessary but not sufficient for voice.
In a text interface, the first token is the moment the user sees something happen. In a voice interface the user hears nothing when the first token is generated, because the token still has to be synthesized into audio and streamed down the line. TTFT measures the model. The caller experiences the whole pipeline.
A voice turn budget spans speech-to-text on the inbound audio, end-of-turn detection deciding the caller has actually finished, model inference, text-to-speech synthesis, and the network path in both directions. A voice AI evaluation metrics guide defines TTFT in this context as how quickly the agent starts speaking after the user's utterance ends, which is the version that matters operationally.
End-of-turn detection deserves particular attention, because a mistake there costs more than a slow model. Detect the end too early and the agent interrupts. Detect it too late and you have added dead air that no amount of inference speed recovers. The mechanics are covered in this explainer on endpointing and turn detection.
How Fast Does a Voice Agent Actually Need to Be?
There is a real answer to this, and it comes from linguistics rather than from engineering.
A 2009 study in PNAS measured turn transitions across a worldwide sample of 10 languages, from traditional indigenous communities to major world languages. It timed the elapsed interval between the end of a question turn and the start of the response, across roughly 3,500 questions in 101 conversations. The cross-language mean response offset was 208 milliseconds, and the overall modal offset was 0 milliseconds. Language-specific means fell within roughly 250 ms either side of that average, with Japanese fastest at +7 ms and Danish slowest at +469 ms.
That is the bar human listeners are calibrated to. It is not a target any current voice agent hits, and it is worth being honest about the size of the gap rather than pretending 800 ms feels natural.
A second reference point comes from distributed systems, where tail latency has been studied far longer than it has in voice. Dean and Barroso open The Tail at Scale (Communications of the ACM, 2013) by citing the long-standing finding that systems responding "within 100 milliseconds" feel "more fluid and natural to users than those that take longer". Voice sets that bar lower still. A caller has no spinner to look at, and no way to tell a slow agent from a broken line.
Put the two together and the picture is clear. You have a few hundred milliseconds of headroom before a conversation starts feeling wrong, and a single slow stage anywhere in the path can consume all of it.
What Causes P99 Latency Spikes in Voice Agents?
Tail latency in voice is rarely one broken component. It is usually a stage that behaves consistently most of the time and occasionally takes a different path. These are the ones that show up repeatedly.
- A tool call inside the turn. If the agent has to look up an account balance or check availability before it can answer, the caller waits for your CRM. A database that answers in 80 ms at the median and 900 ms at its own p99 puts that entire tail straight into the conversation.
- Endpointing waiting on silence. Most end-of-turn detection waits for a fixed silence threshold before declaring the caller finished. That threshold is dead time added to every turn, and it stretches when the caller pauses mid-sentence to think.
- Speech-to-text finalization. Interim transcripts arrive fast, but many pipelines wait for the final, punctuated transcript before prompting the model. The gap between last interim and final result is invisible in isolation and real in aggregate.
- Variable response length. Token generation is roughly linear in output length. An agent that usually answers in fifteen words and occasionally produces a sixty-word explanation has built a tail into its own prompt.
- Text-to-speech queuing. Synthesis is fast at low concurrency and queues under load. Because it sits at the end of the turn, any delay there lands directly on the caller with nothing left to absorb it.
- Cold starts and model warm-up. The first call after an idle period routinely runs slower than the thousandth. If your traffic is bursty, a meaningful share of calls are first calls.
- Concurrency. Queuing shows up in the tail long before it shows up in the median. A system benchmarked one call at a time will not reveal it, which is why concurrent testing matters more for latency than for correctness.
The common thread is that each of these is invisible in the median and obvious in the tail. That is not a coincidence. It is what a percentile is for.
How Do You Reduce Tail Latency in a Voice Agent?
Every fix here costs something. Latency work is a trade, and the expensive mistake is optimizing a stage that was never the bottleneck.
- Stream end to end. Start synthesizing audio from the first tokens rather than waiting for the full model response. Cost: the agent commits to a sentence before it has finished planning it, so mid-sentence corrections become impossible.
- Take tool calls off the critical path. Prefetch likely lookups while the caller is still speaking, or acknowledge verbally while the call runs in the background. Cost: prefetching does work you often throw away, and filler phrases sound artificial if overused.
- Cap response length in the prompt. Shorter answers generate faster and compress the tail. Cost: some questions genuinely need a longer answer, and a hard cap truncates them.
- Tune the endpointing threshold to the use case. A shorter silence window cuts dead air on every turn. Cost: more interruptions of callers who pause to think, which is worse than waiting in most consumer contexts and better in short transactional ones.
- Co-locate the stack. Keep speech-to-text, inference and synthesis in one region and close to the telephony edge. Cost: regional capacity limits and a harder failover story.
- Cache what repeats. Greetings, disclosures and menu prompts do not need synthesizing afresh on every call. Cost: little, which is why this one is usually worth doing first.
Measure the stage breakdown before choosing among these. Teams routinely optimize model inference when the tail was actually coming from a tool call, and spend a quarter making the fast part faster.
What the Benchmark Data Shows About Tail Latency
Cekura ran a controlled benchmark of voice orchestration platforms that measures per-turn response latency directly. One byte-identical agent was deployed across six platforms. The benchmark states its own precondition: "With the model, prompt and TTS fixed, per-turn latency reflects the platform's turn-taking: endpointing, VAD, buffering and network path". Roughly 1,050 to 1,570 turns were measured per platform, across three runs each.
Two caveats travel with the numbers. Speech-to-text and speech synthesis are pinned with per-platform exceptions. The telephony path also differs by platform, native in some cases and SIP-bridged in others, so part of the spread below is carrier path rather than orchestration.
Sorted by median, the per-turn results were:
| Platform | Median (P50) | 95th percentile | P50 to P95 multiplier |
|---|---|---|---|
| ElevenLabs | 1,730 ms | 3,194 ms | 1.85x |
| Retell | 1,960 ms | 3,789 ms | 1.93x |
| Vapi | 2,340 ms | 2,950 ms | 1.26x |
| LiveKit | 2,460 ms | 3,870 ms | 1.57x |
| Pipecat | 3,150 ms | 5,419 ms | 1.72x |
| Synthflow | 3,160 ms | 5,080 ms | 1.61x |
Three findings are worth carrying into a vendor decision.
Every platform sits far above human timing
ElevenLabs led on median at 1,730 ms, which is more than eight times the 208 ms offset people leave between a question and its answer. The slowest, Synthflow at 3,160 ms, is more than fifteen times. None of the six is close to natural pacing, and a figure that sounds closer is usually measuring something narrower than a full turn.
The ranking inverts between the median and the tail
Vapi placed third on median at 2,340 ms but first at the 95th percentile at 2,950 ms, ahead of ElevenLabs at 3,194 ms. The reason is consistency rather than speed. Vapi's P50 to P95 multiplier was 1.26, the tightest in the group, against 1.85 for ElevenLabs and 1.93 for Retell. A shortlist built on median alone picks a different vendor than one built on the tail, and callers experience the tail.
The worst single recorded turn was 10,400 ms
It happened on ElevenLabs, the same platform with the best median. A turn of more than ten seconds is not a slow response, it is an abandoned call. No average anywhere near 1,730 ms would ever surface it.
Cekura states the caveat plainly: these are platform defaults, and results shift once an agent is tuned for a specific use case. Treat the benchmark as a shortlisting instrument rather than a prediction of your own production numbers.
Why P99 Is Unreliable at Low Call Volumes
Percentiles need volume, and voice deployments usually have far less of it than the web services this metric was designed for. An API handling a million requests a day has a p99 built from 10,000 measurements. A contact center handling 200 calls a day does not.
The fix is to measure over turns rather than calls. A 200-call day at eight turns per call produces 1,600 turn measurements, where p99 is the sixteenth slowest turn. Measured per call instead, p99 is the second slowest call of the day, which is not a percentile so much as an anecdote.
Below roughly a thousand measurements, prefer P90. It is stable at volumes where P99 still swings on single events, and it catches the same structural problems a few days earlier than complaints do. Move to P99 once you have the traffic to make it mean something.
One more measurement trap carries over from web services. Never average pre-computed percentiles across instances or time buckets. The average of several p99 values is not the p99 of the combined data, and the error always flatters the tail you are trying to catch. Aggregate the raw measurements, or use histogram-based aggregation.
How Do You Measure Latency Percentiles for a Voice Agent?
Production monitoring tells you what happened. It does not tell you what will happen when a prompt changes, when call volume triples, or when a model version is swapped. For those you need to generate the traffic deliberately.
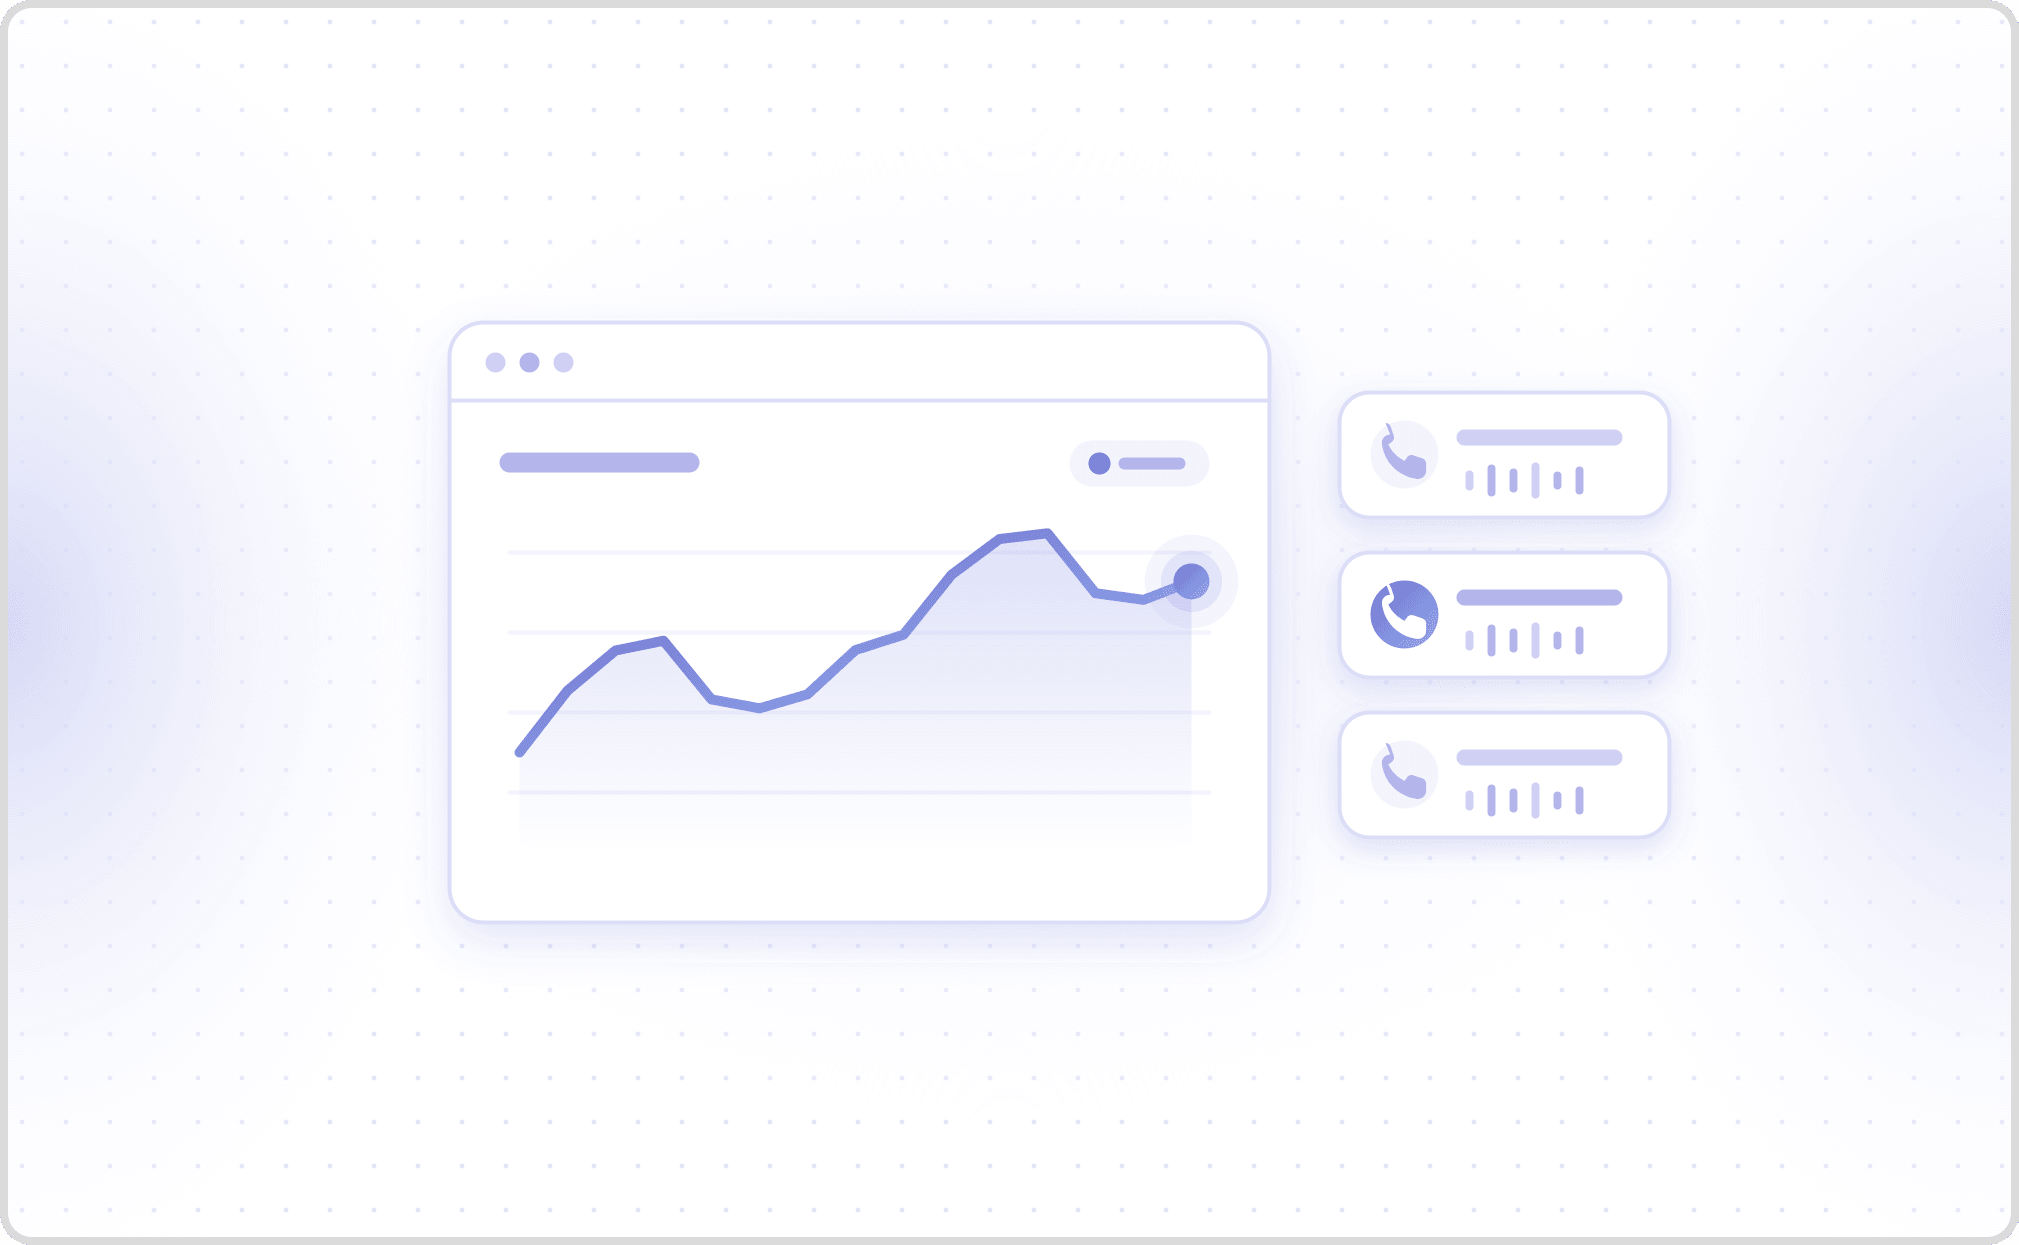
- Instrument per turn, not per call. Record the interval from end-of-user-speech to start-of-agent-speech for every turn, and keep the raw values rather than a running average.
- Break the turn into stages. Capture speech-to-text, endpointing, inference and synthesis separately. An end-to-end p99 tells you there is a problem; the stage breakdown tells you which subsystem owns it. Histogram-backed tooling, whether Prometheus, Datadog, Grafana or OpenTelemetry spans per pipeline hop, gives you per-stage percentiles without storing every raw value.
- Run the same scenario repeatedly. A single pass gives you no distribution at all. Percentiles only exist across repeated runs of comparable turns.
- Test under concurrency. Tail latency is where queuing shows up first, and a system measured one call at a time will not reveal it. Cekura's voice load testing guide covers generating concurrent call volume.
- Gate releases on the tail, not the mean. A practical starting gate is P95 at your current median times 1.5, since the tightest platform in the benchmark above ran a 1.26x P50 to P95 multiplier and the widest ran 1.93x. Fail the build when it regresses, the same way you would for a correctness test.
For the broader testing methods that surround this measurement, including load, audio-layer and conversation-flow testing, Cekura's guide to voice agent performance testing covers the five approaches in more detail.
Where Does Cekura Fit?
Cekura tests, monitors, and self-improves voice and chat AI agents, and latency percentiles are one of the metrics it scores on every run rather than an add-on.
Cekura runs scenario suites as simulated calls against an agent and records per-turn latency across every run, so the distribution exists before the agent takes a real call. Cekura reports the percentiles rather than an average, gates prompt and model changes in CI against them, and then scores production conversations continuously once the agent is live. Cekura integrates natively with Vapi, Retell, LiveKit, Pipecat and ElevenLabs, so an existing agent can be measured without being rewritten.
Latency is one layer of the picture. An agent can be fast and still wrong, which is why per-turn timing sits alongside transcription accuracy, tool call success, instruction following and interruption handling rather than standing in for them.
FAQ
What is p99 latency?
P99 latency is the 99th percentile of measured response times: 99 percent of responses are at least that fast and 1 percent are slower. It is a ceiling rather than an average, which is why it exposes the slow responses that an average conceals.
What is the difference between p50, p90 and p99?
P50 is the median, describing a typical response. P90 marks where degradation begins and covers the worst 10 percent. P99 describes what a bad interaction actually felt like. The gap between P50 and P99 matters more than any of them alone, because a wide gap means some requests take a different path through the system.
What is a good latency for a voice AI agent?
Human conversation has a mean offset of about 208 milliseconds between a question and its answer, so that is the perceptual bar rather than an achievable target today. The fastest platform in Cekura's six-platform voice benchmark sits at 1,730 ms at the median, eight times higher, measured on platform defaults before any per-use-case tuning. Current platforms measure in seconds, so track your own tail and improve it rather than chasing a published number.
Is TTFT the same as voice agent latency?
No. Time to first token measures when the language model produces its first output token. In voice the caller hears nothing at that moment, because the token still has to be synthesized into audio and streamed. TTFT is one stage of a turn that also includes speech recognition, end-of-turn detection, synthesis and the network path.
Why does my p99 latency keep jumping around?
Usually insufficient sample size. A percentile is only as stable as the number of measurements behind it, and at 200 calls a day your p99 is the second slowest call, which moves on single events. Measure percentiles over turns rather than whole calls to multiply your sample, and use P90 until traffic supports P99.
Should I track average latency at all?
It is useful for spotting a system-wide regression, where everything slows at once. It is close to useless for user experience. Google's Site Reliability Engineering puts it bluntly: a service averaging 100 ms at 1,000 requests per second can easily have 1 percent of requests take 5 seconds. Track the average for capacity and the percentiles for quality.
Cekura measures per-turn latency at percentiles across every simulated run, before your agent takes a real call. Book a demo to see the distribution for your own agent.