
I compared 12 observability platforms on deployment, pricing model, and the main limitation of each tool.
Cekura ranks first for voice and chat AI agents, and it still needs a general platform next to it for servers and databases. For general infrastructure, I'd start with Datadog if you want one vendor, or Grafana with Prometheus if you'd rather self-host.
What Are Observability Platforms?
Observability platforms collect and correlate telemetry from your systems so engineers can ask new questions about production without deploying new code.
This guide covers four types of telemetry. Logs are timestamped records of events, metrics are numeric measurements over time, traces follow one request across services, and events are discrete changes such as a deploy or an alert firing.
Monitoring alerts on conditions you set in advance, like CPU above 90%. Observability gives you the data to chase failures you never planned for. Datadog and Grafana both offer alerting on defined conditions and ad hoc querying of telemetry, so the two are related approaches.
The 12 Best Observability Platforms in 2026 (TL;DR)
-
Cekura: Choose Cekura if you run voice and chat AI agents and need to test before launch and monitor live calls.
-
Datadog: Choose Datadog if you want infrastructure, APM, and logs from a single SaaS vendor.
-
Dynatrace: Choose Dynatrace if you run a large hybrid estate and want the platform to find root causes.
-
Grafana: Choose Grafana if you want dashboards over data stored in several places.
-
New Relic: Choose New Relic if you prefer usage-based billing on data ingest and want an entry plan at no cost.
-
Splunk Observability Cloud: Choose Splunk Observability Cloud if Splunk holds your logs and security data.
-
Elastic Observability: Choose Elastic Observability if you already search and analyze logs on Elasticsearch.
-
Honeycomb: Choose Honeycomb if you debug high-cardinality production problems in distributed systems.
-
OpenObserve: Choose OpenObserve if you want a self-hosted, SQL-queryable replacement for an ELK stack.
-
Prometheus: Choose Prometheus if you run Kubernetes and need open-source metrics and alerting.
-
Middleware: Choose Middleware if you're a small team that wants a free tier and per-GB pricing for core telemetry.
-
Langfuse: Choose Langfuse if you build LLM applications and want open-source tracing, prompt management, and evals.
How I Researched These Observability Platforms
I reviewed each product's pricing page and documentation, plus its trust page and changelog or blog where they exist, then read user reviews on G2 and Product Hunt.
I didn't run hands-on tests on these platforms, and I attribute each vendor claim to the page it came from. Where a vendor publishes no figure, I say so.
Five criteria drive the ranking, weighted toward AI-agent observability.
-
Features: Whether the tool collects the full telemetry set and how it treats AI workloads.
-
Deployment: SaaS, self-hosted, or both, and whether you control where data lives.
-
Pricing model: What the vendor charges for (hosts, gigabytes, events, users) and how predictable the invoice is.
-
Integrations: Native support for OpenTelemetry and the tools in your stack.
-
Limitations: The main constraint you should know about before committing.
I checked pricing against vendor pages on 6 October 2026. Confirm current numbers with the vendor before you commit.
I left out cloud provider monitors such as AWS CloudWatch and Azure Monitor because each covers one cloud. Coralogix and SigNoz are also out, since I couldn't verify enough from their official pages in the time I had.
If AI agents are your main concern, Cekura's guide to LLM observability covers that angle.
12 Best Observability Platforms in 2026 Compared at a Glance
| Tool | Strengths | Best for | Starting price (unit differs by row) | Billed by |
|---|---|---|---|---|
| Cekura | Simulation, call monitoring, red teaming, alerts | Voice and chat AI agents | $0 pay-as-you-go ($0.25 per voice testing minute) | Testing minute and monitored call |
| Datadog | Infrastructure, APM, logs, 1,000+ integrations | One-vendor SaaS stacks | Free, then $15 per host per month | Host |
| Dynatrace | Davis AI root cause, full-stack monitoring | Large hybrid enterprises | $7 per host per month | Host, by memory |
| Grafana | Dashboards, Loki, Tempo, Mimir | Teams with many data sources | Free, then $19 per month plus usage | Monthly plan plus usage |
| New Relic | APM, logs, AI monitoring, ingest billing | Usage-based buyers | 100 GB free, then $0.40 per GB | GB ingested and users |
| Splunk Observability Cloud | Live metrics, traces, alert correlation | Existing Splunk shops | $15 per host per month | Host |
| Elastic Observability | Log search, PromQL, serverless or self-managed | Elasticsearch users | From $0.07 per GB ingested | GB ingested, retention, and egress |
| Honeycomb | High-cardinality queries, BubbleUp, OTel-native | Teams debugging distributed systems | Free, then $150 per month | Monthly plan plus events |
| OpenObserve | SQL and PromQL, eBPF zero-code, Rust engine | Teams replacing ELK | Free self-hosted, cloud $0.50 per GB | GB ingested and GB queried |
| Prometheus | Pull-based metrics, PromQL, alerting | Kubernetes metrics teams | Free (open source) | Not applicable |
| Middleware | Infrastructure, APM, logs, RUM; per-GB billing for metrics, logs, and traces | Small teams | Free to 100 GB, then $0.30 per GB | GB, with RUM by session |
| Langfuse | LLM tracing, prompt versions, evals | LLM app teams | Free, then $29 per month | Monthly plan plus units |
Note: starting prices use different units and tiers, so rows can't be compared directly, and the Billed by column shows each unit. Datadog and Splunk price per host with annual terms, and Dynatrace's $7 is its Foundation & Discovery tier.
New Relic also charges per user. Compare prices at your own volume.
1. Cekura, Best for Voice and Chat AI Agent Observability
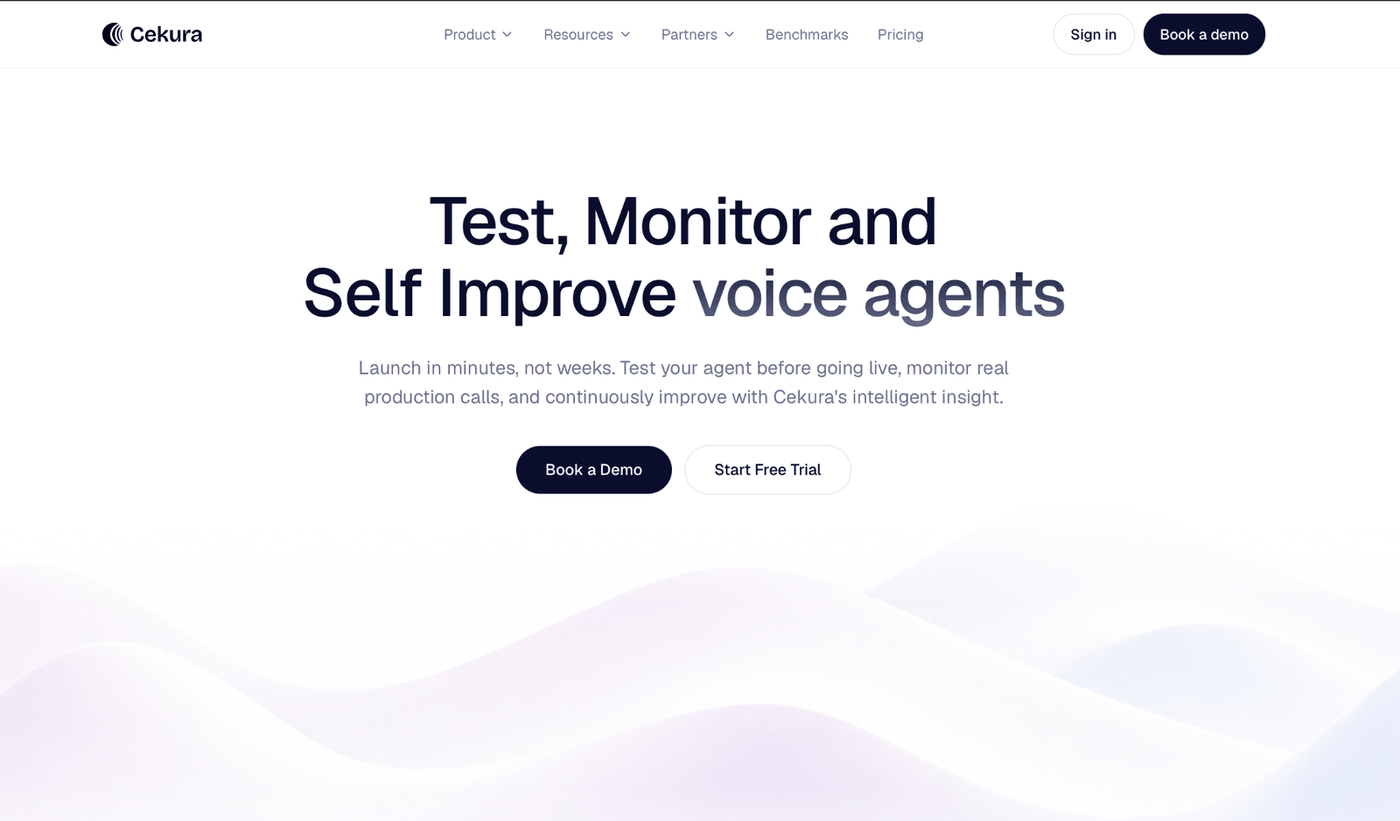
What it does: Cekura tests voice and chat AI agents with simulated conversations before launch, then scores live calls afterward.
Best for: Finding out why a call failed, from the audio to the tool call.
Cekura's scope is narrower than the infrastructure suites below, which is why it leads this list for AI-agent teams.
Cekura's voice observability guide defines the discipline as connecting "call audio, STT output, LLM reasoning, tool calls, TTS quality, and production outcomes in one trace." CPU and memory graphs don't record that a caller was interrupted mid-sentence.
The platform runs thousands of synthetic conversations before launch and flags drift across live calls. It tests latency and interruptions, and teams can gate every deploy on the test suite.
Key Features
-
Simulation: Sends synthetic callers at your agent before launch.
-
Production call monitoring: Scores live calls against metrics you define and sends notifications when quality drops.
-
Red teaming and CI/CD gating: Probes for jailbreaks and failures before release.
-
Native integrations: Cekura works out of the box with Retell, VAPI, ElevenLabs, LiveKit, Pipecat, Bland, and more, so teams add a testing and monitoring layer over what they already run.
-
Cekura supports SOC 2, HIPAA, and GDPR compliance, covering transcript redaction, role-based access, and audit trails.
Pros and Cons
Pros:
✅ Lets you test before paying, with 300 free credits (about 60 minutes of voice testing) and no credit card.
✅ Scores calls on your own pass/fail rules, since unlimited custom Python metrics come free alongside 10+ standard ones.
✅ Includes production call alerts and API access on every plan, so a small team gets monitoring without the $500 Startup plan.
Cons:
❌ Limited to AI agents, so infrastructure telemetry still needs a general platform.
❌ Has few public reviews compared with the established vendors here.
What Users Say

"We've tried a few platforms for voice agent testing and Cekura has been the best by a long shot. Keep up the great work!" (Niko-Thomas, Hacker News)
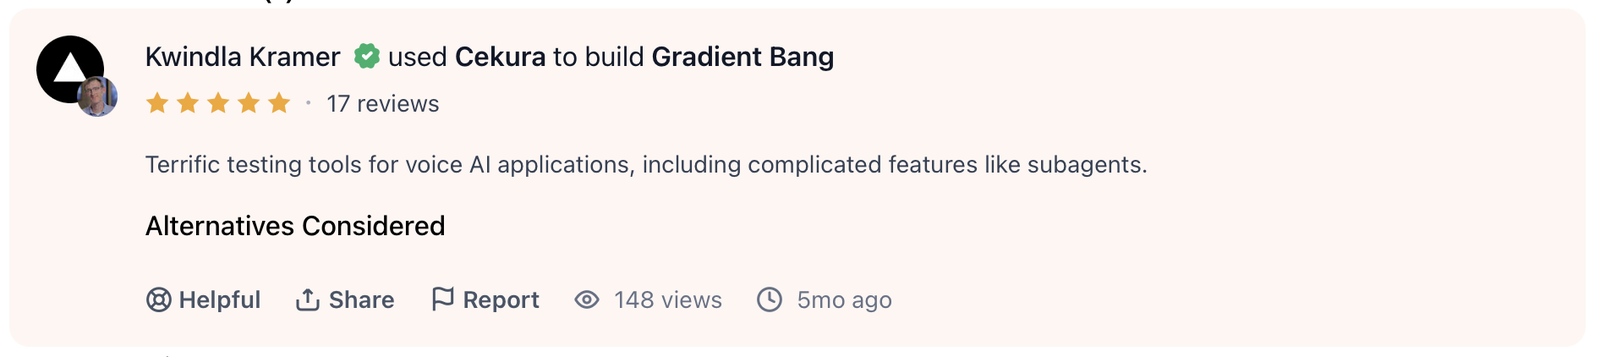
"Terrific testing tools for voice AI applications, including complicated features like subagents." (Kwindla Kramer, Product Hunt)
As of 6 October 2026, I found no critical review of Cekura on G2 or Product Hunt, so there's no negative quote to show.
Pricing
Startup is $500 per month, and Enterprise is custom. Pay-as-you-go starts at $0 with the first user free, then $0.25 per voice testing minute and $0.05 per monitored call.
Bottom Line
For the infrastructure underneath, pair it with Datadog, Grafana, or a similar tool.
2. Datadog, Best for One-Vendor SaaS Observability
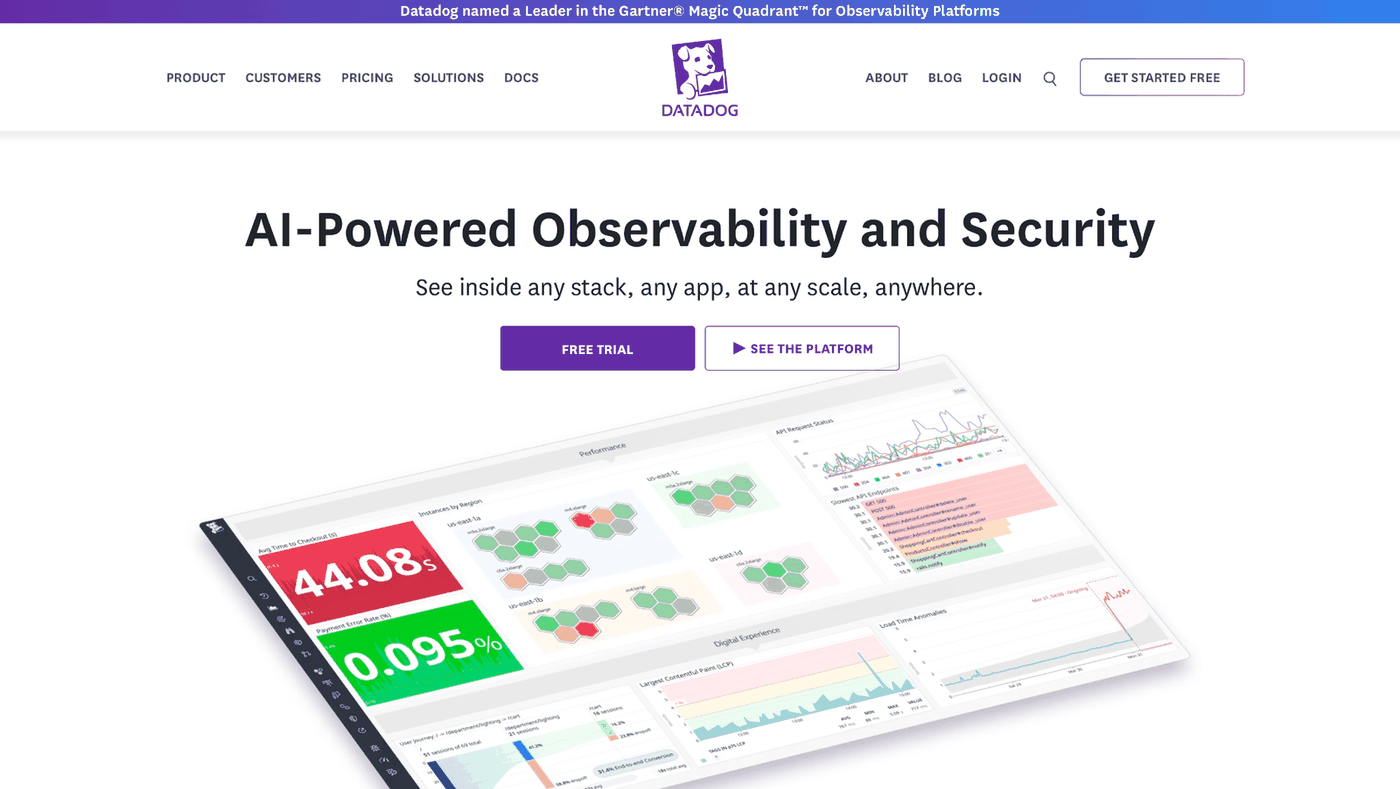
What it does: Datadog is a SaaS observability platform covering infrastructure monitoring, APM, log management, and alerting.
Best for: Stacks that want one SaaS vendor for the whole telemetry pipeline, with 1,000+ integrations on the Pro plan.
Datadog's Pro infrastructure plan lists 1,000+ integrations. Its docs describe distributed tracing with "out-of-the-box dashboards" and correlation with other telemetry. Its docs also describe Agent Observability for LLM-powered applications.
Billing takes several forms. Infrastructure and APM bill per host, while log management bills per ingested or scanned gigabyte, so one environment produces several line items.
Portability comes with a condition too. Datadog's OpenTelemetry docs say that fully instrumenting with OpenTelemetry means some Datadog features are not supported, while pairing the OpenTelemetry API with Datadog's SDK gives access to its full feature set.
For regulated buyers, Datadog's trust page lists SOC 2 Type II, ISO 27001, HIPAA, and FedRAMP High (listed for Datadog for Government).
Key Features
-
Distributed tracing and APM: A request's path across services links to your logs and infrastructure metrics.
-
Log management: Ingestion and indexing, with exclusion rules to control volume.
-
Agent Observability: Monitoring and evaluation for LLM-powered applications, according to Datadog's docs.
Pros and Cons
Pros:
✅ Keeps 15 months of metrics on Pro, so you can compare this quarter with the same period last year.
✅ Doesn’t price by seat or alert on paid tiers, so the whole on-call rotation can use it.
✅ Stores logs cheaply for audits, with Flex Storage holding them up to 15 months and archive forwarding to S3, GCP, or Azure included in the ingestion price.
Cons:
❌ Billing uses several meters (host and GB), so total cost depends on which products you enable.
❌ Datadog-specific features need the Datadog SDK, which ties those features to Datadog's tooling.
❌ Self-hosting is limited to log management through BYOC Logs, which runs in your own infrastructure. I found no self-hosted option for the other products.
What Users Say
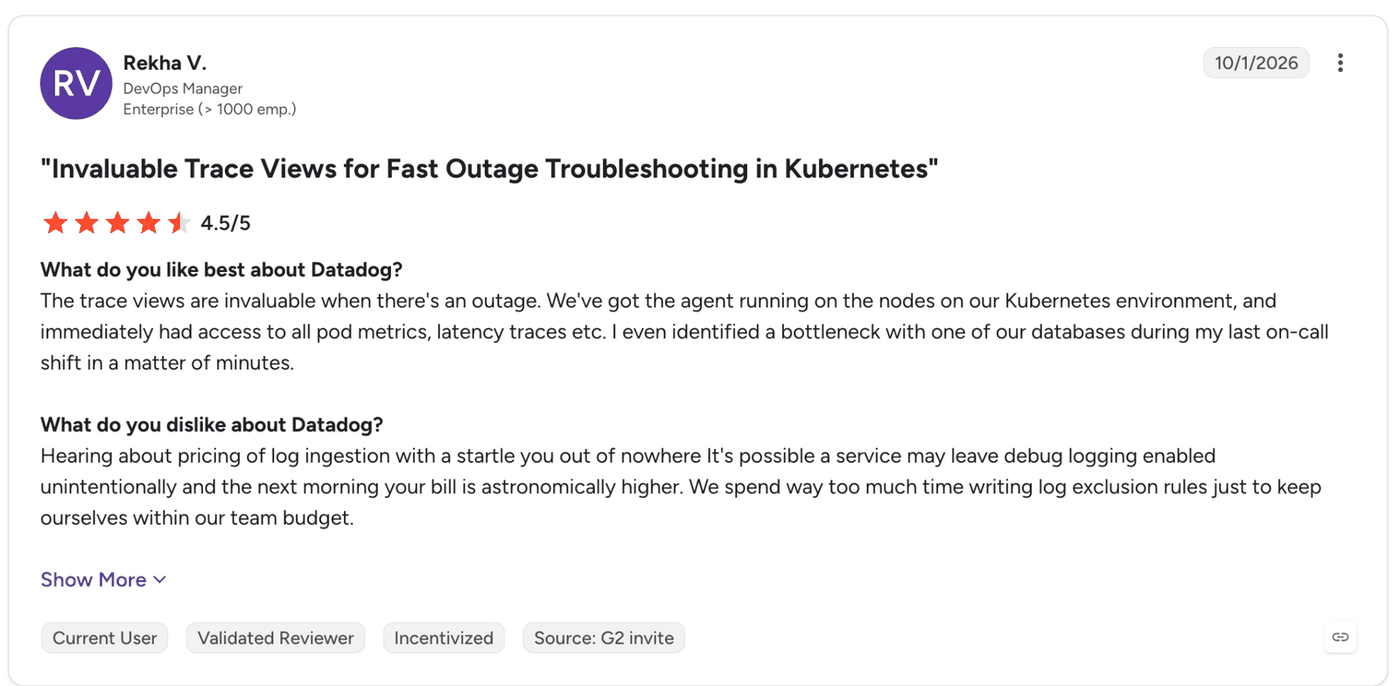
"I even identified a bottleneck with one of our databases during my last on-call shift in a matter of minutes." (Rekha V., DevOps Manager, G2)
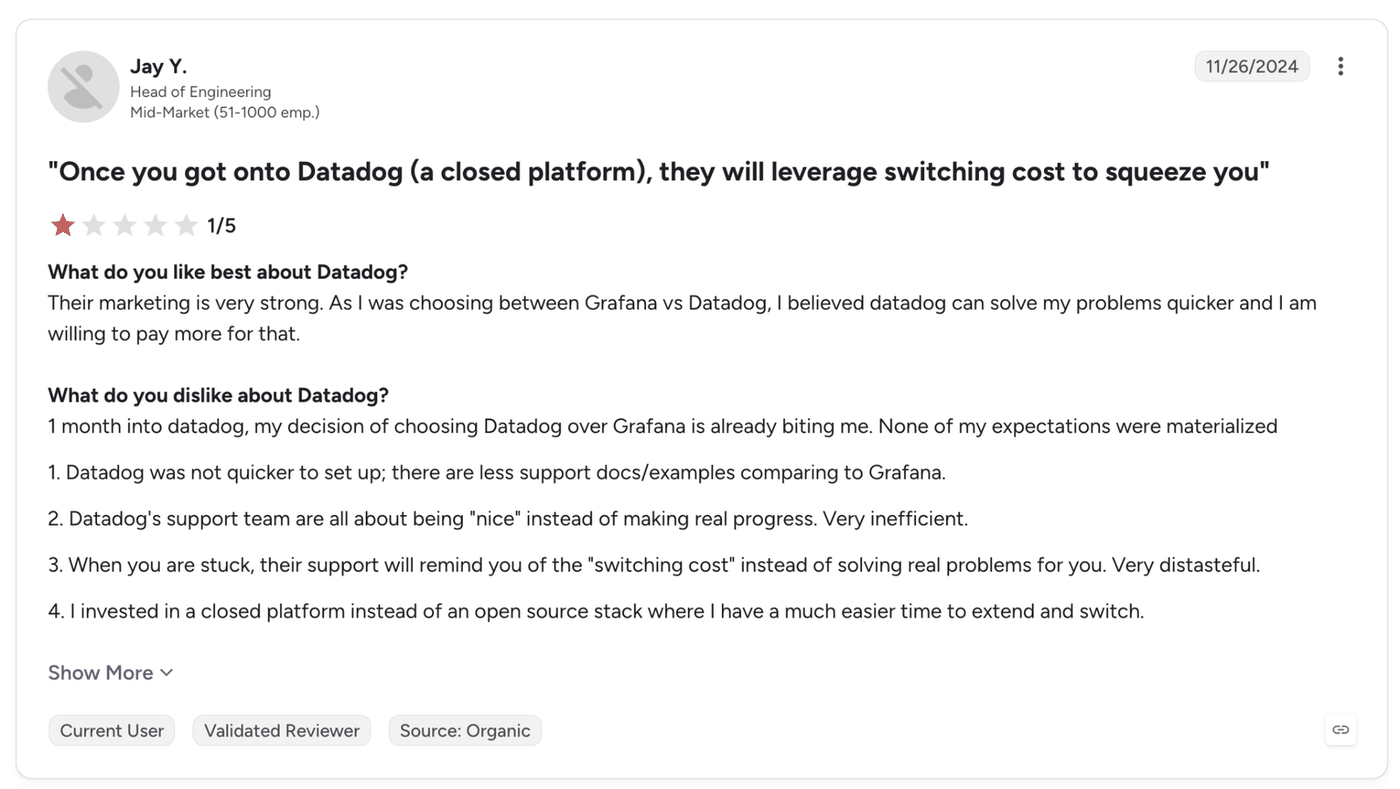
"Datadog was not quicker to set up; there are less support docs/examples comparing to Grafana." (Jay Y., Head of Engineering, G2)
Pricing
Pro is $15 per host per month billed annually ($18 on demand), and Enterprise is $23 annually ($27 on demand). The Free plan covers up to 5 hosts with 1-day metric retention.
Bottom Line
Datadog puts the whole stack with one vendor, and a month of live traffic will show you what that costs.
3. Dynatrace, Root-Cause Analysis for Enterprises
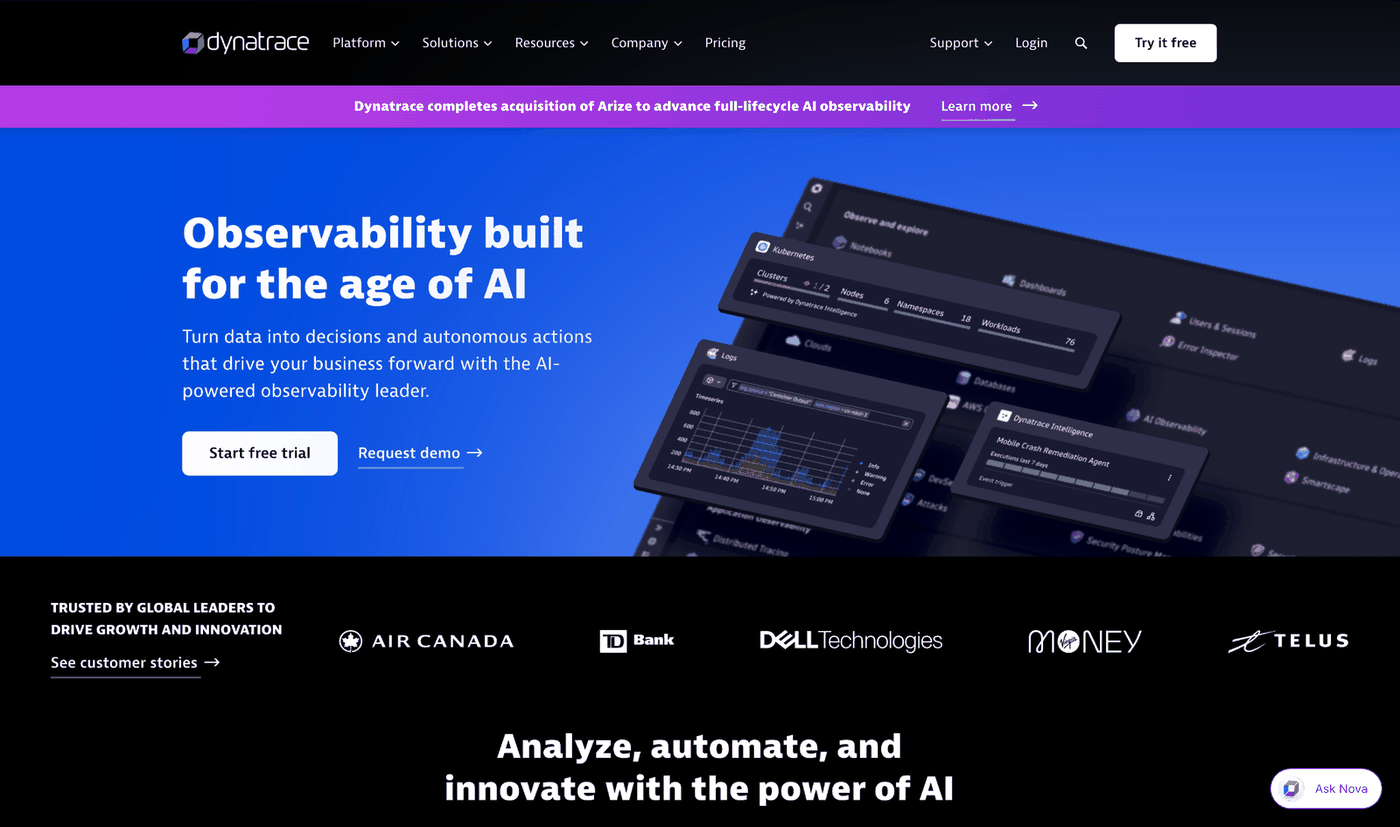
What it does: Dynatrace is an observability platform for monitoring applications, infrastructure, and logs, with Davis AI problem analysis.
Best for: Large hybrid or multi-cloud estates where you want the platform to identify root causes.
Davis AI, per Dynatrace's docs, "analyzes problems to determine their root cause" and "detects anomalies in your environment." Dynatrace is also adding AI observability after completing its acquisition of Arize on 1 October 2026.
One documented limitation matters for web teams. If your front end reports through OpenTelemetry, Dynatrace's docs say "you will not get RUM-specific capabilities such as frontend management, user sessions, user actions, Core Web Vitals, or Session Replay."
Dynatrace's Trust Center names SOC 2 Type II, ISO 27001, FedRAMP Moderate, HIPAA, and GDPR. Span retention is configurable from 10 days to 10 years, depending on the bucket.
Key Features
-
Davis AI analysis: Detects anomalies and traces a problem to its likely root cause.
-
Full-stack monitoring: Prices hosts by memory size, so cost follows the size of what you run.
-
OpenTelemetry ingest: Takes telemetry through the OTel Collector or direct export, though OTel frontend data loses RUM features.
Pros and Cons
Pros:
✅ Maps live dependencies with Smartscape, so a fault is traced across services instead of pieced together from separate alerts.
✅ Cuts manual triage, because its SRE agent enriches tickets automatically before an engineer opens them.
✅ Lets engineers ask questions in plain language through Dynatrace Assist, with no query language to learn first.
Cons:
❌ OTel frontend data loses RUM features, so web teams need Dynatrace's own agent for them.
❌ Pricing requires one annual commitment at the platform level.
❌ Self-hosting means Dynatrace Managed, which you deploy as a cluster. I didn't compare its features with the SaaS version.
What Users Say
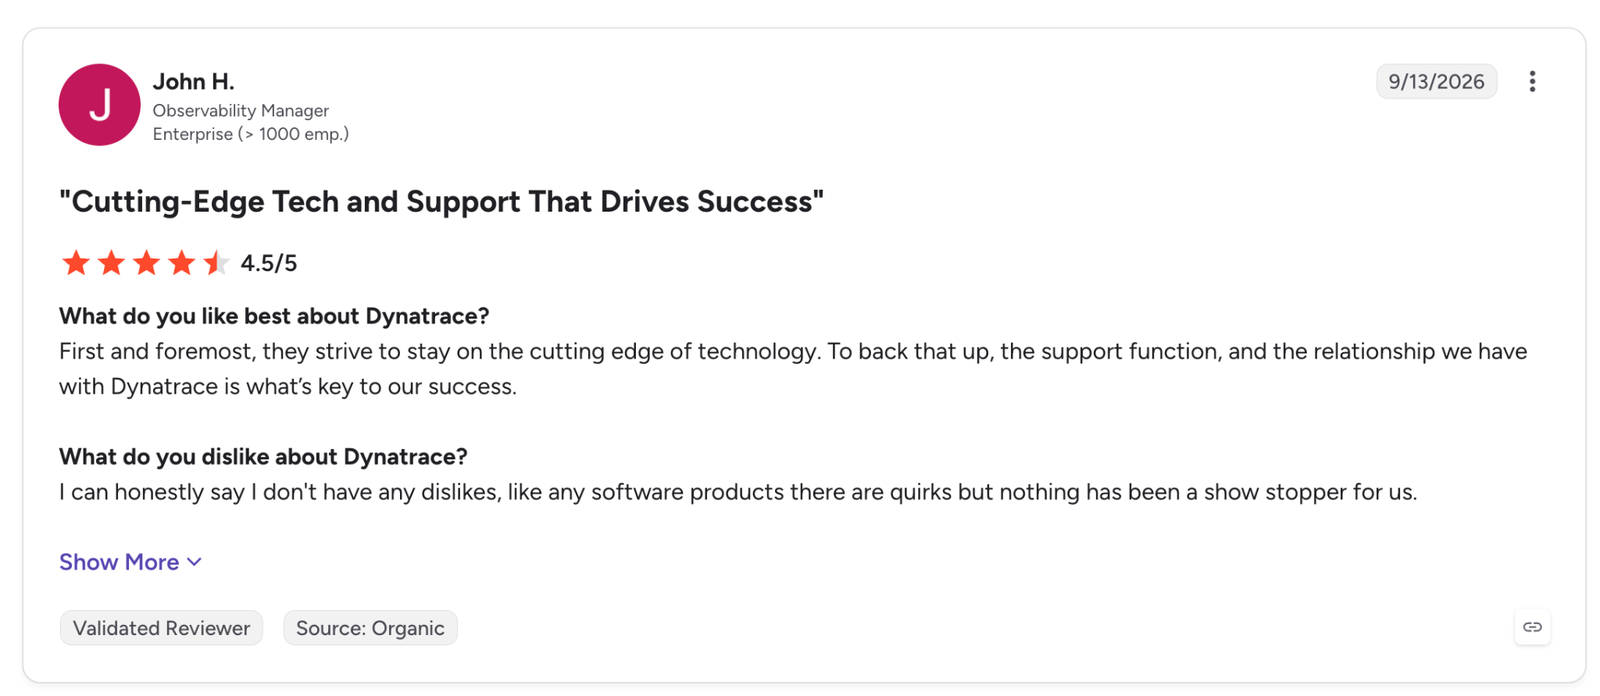
"…the support function, and the relationship we have with Dynatrace is what's key to our success." (John H., Observability Manager, G2)
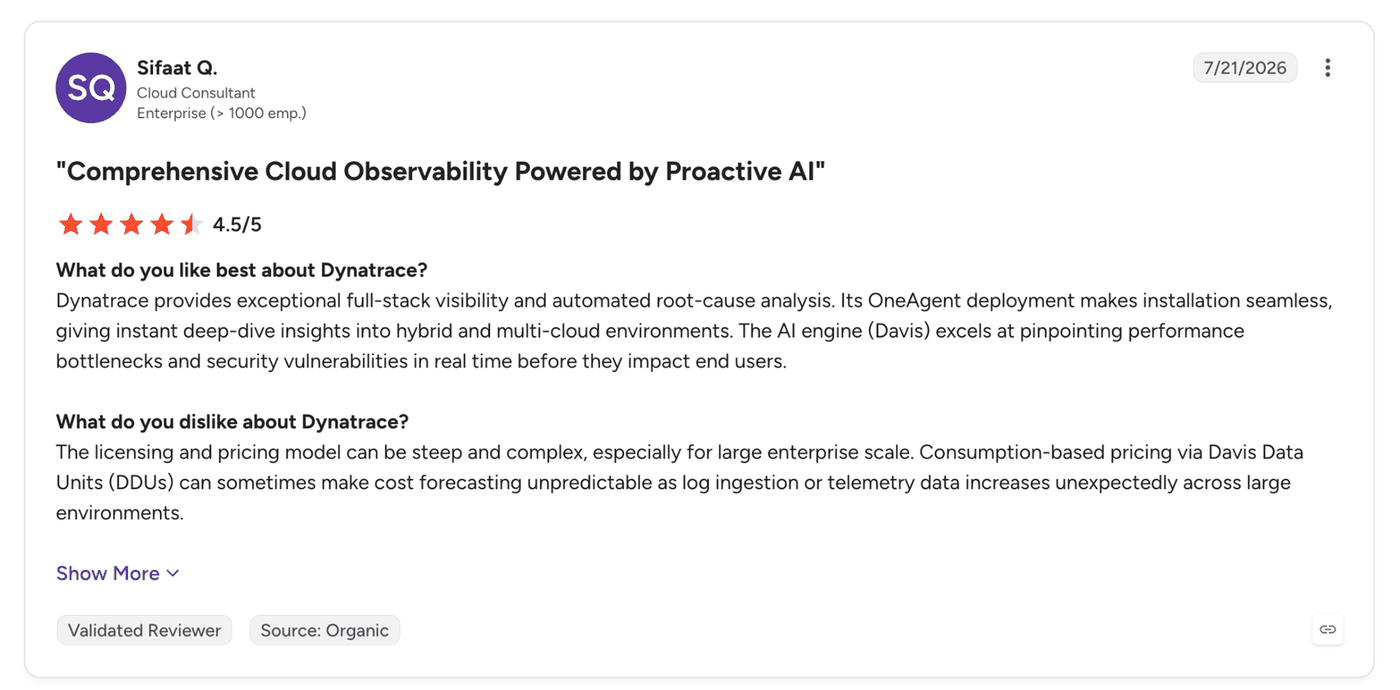
"Consumption-based pricing via Davis Data Units (DDUs) can sometimes make cost forecasting unpredictable as log ingestion or telemetry data increases unexpectedly across large environments." (Sifaat Q., Cloud Consultant, G2)
Pricing
Foundation & Discovery is $7 per host per month, Infrastructure Monitoring is $29, and Full-Stack Monitoring is $58 per 8 GiB host. Kubernetes Platform Monitoring is $1.40 per pod per month.
Bottom Line
Dynatrace suits an enterprise that wants automated root-cause analysis in place of manual alert correlation. Startups should read the commitment terms before a trial.
4. Grafana, Dashboards Over Many Data Sources
What it does: Grafana visualizes and alerts on your telemetry wherever it is stored, as open source or as the managed Grafana Cloud.
Best for: Dashboards over data that lives in several systems.
Grafana's introduction docs say the software lets you "query, visualize, alert on, and explore your metrics, logs, and traces wherever they are stored."
Grafana Cloud adds hosted back ends for each signal, with Loki for logs, Tempo for traces, and Mimir for metrics, and its Pro tier includes 13-month metrics retention.
Data can also arrive over OpenTelemetry. Per Grafana's OTLP docs, Grafana Labs supports ingesting metrics, logs, and traces over OTLP and converts the data into those native formats.
You can run Grafana three ways: as free open-source software (AGPL-3.0), as self-managed Enterprise, or as Grafana Cloud. At larger scale, power users with many dashboards need provisioning scripts and automation, per Grafana's provisioning docs.
Key Features
-
Multi-source dashboards: Builds one view from several sources without copying anything.
-
Alerting: Routes alerts to the channels your team uses.
-
OTLP ingestion: Brings OpenTelemetry data into Grafana Cloud.
Pros and Cons
Pros:
✅ Covers a small service at no cost, since Free Forever includes 10k metric series and 50 GB each of logs, traces, and profiles.
✅ Puts load testing next to monitoring, with 500 k6 virtual user hours and 100k synthetic API checks included on the Free plan.
✅ Adds incident response for three users on Free, so alerts and on-call live in the same tool.
Cons:
❌ Grafana visualizes and routes what's already stored, so a self-hosted setup needs a separate store such as Prometheus or Loki.
❌ Large dashboard estates need provisioning and automation work.
What Users Say
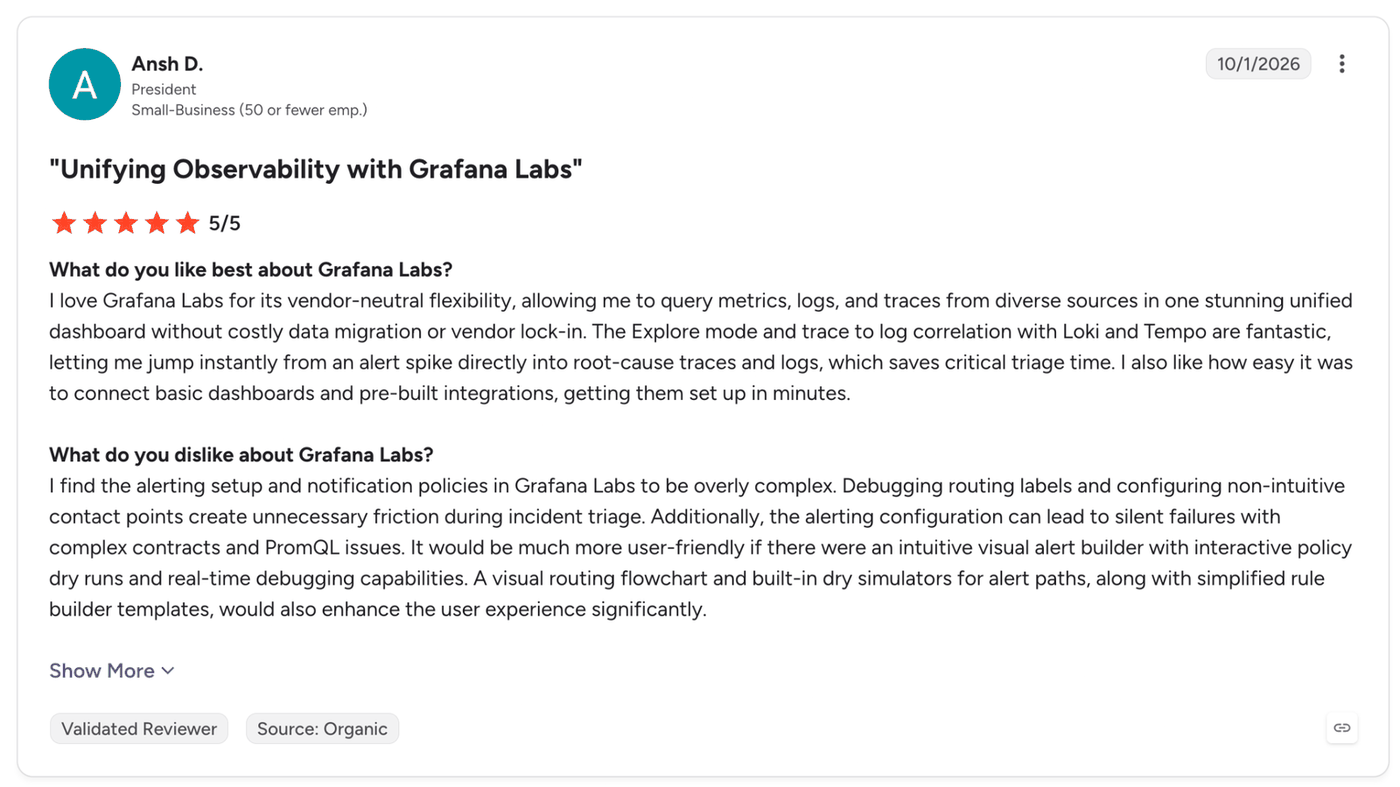
"…query metrics, logs, and traces from diverse sources in one stunning unified dashboard without costly data migration or vendor lock-in." (Ansh D., President, G2)
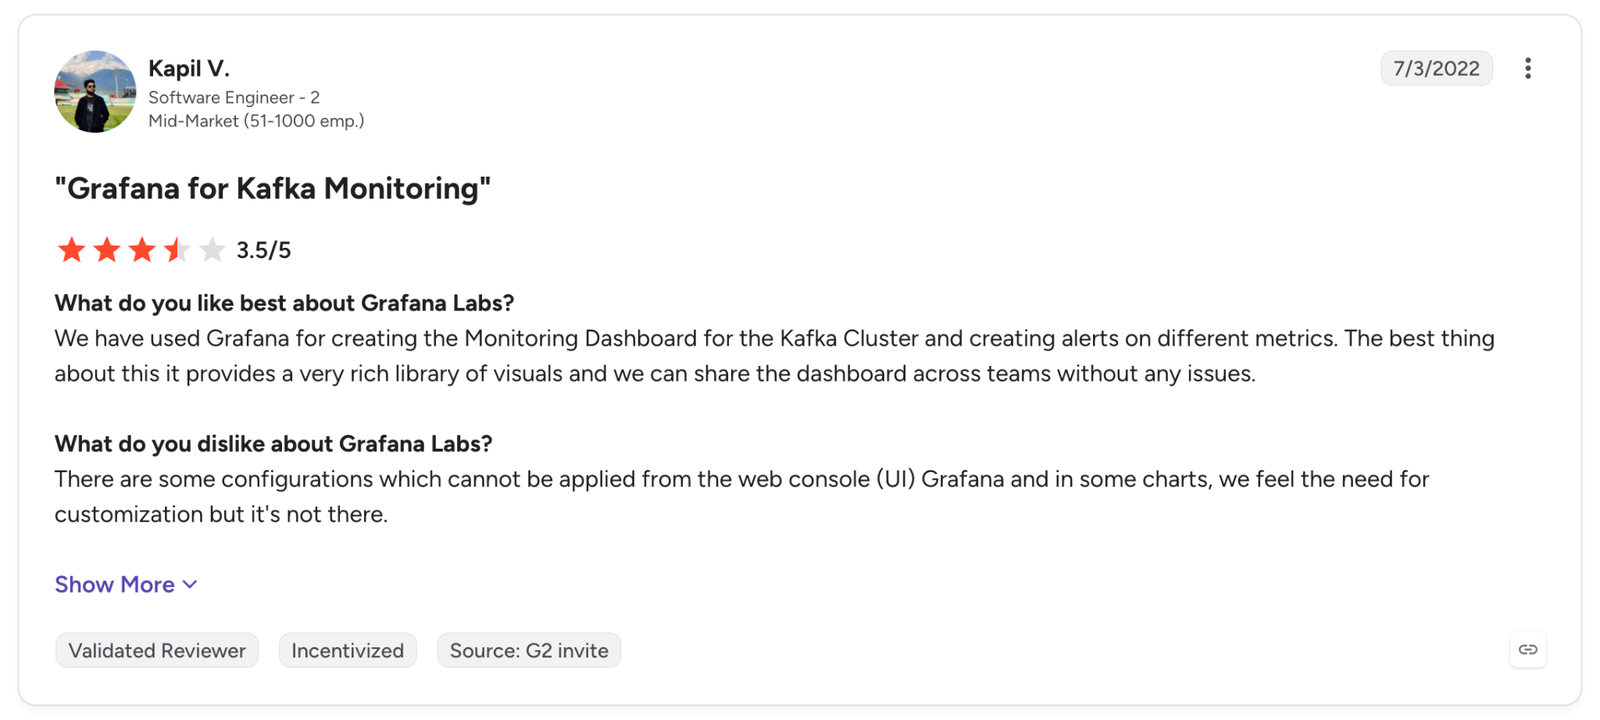
"…in some charts, we feel the need for customization but it's not there." (Kapil V., Software Engineer - 2, G2)
Pricing
Pro starts at $19 per month plus usage, such as $6.50 per 1,000 metric series. Enterprise starts at a $25,000 annual spend commitment. Grafana Cloud Free is $0.
Bottom Line
I'd start with Grafana if you want to keep your data stores and add dashboards on top, then pick the storage layer behind it early, because self-hosting needs a separate store.
5. New Relic, Ingest-Based Billing With a Free Tier
What it does: New Relic is an observability platform with APM, logs, infrastructure, Kubernetes, and AI monitoring.
Best for: Paying by data ingested, starting on a free allowance.
The platform "correlates your telemetry across your entire stack, so you can isolate the root cause and reduce MTTR," according to New Relic's homepage. Its docs add distributed tracing and a Kubernetes integration for cluster health.
Retention on the Original option is 8 days for APM and trace data and 30 days for logs by default, per New Relic's retention docs, so check it against how long your regressions take to appear.
Key Features
-
Distributed tracing: Tracks requests as they move through distributed systems.
-
Kubernetes integration: Reports cluster health and performance.
-
AI monitoring: Tracks tokens, errors, and cost across supported models, according to New Relic's docs.
Pros and Cons
Pros:
✅ Keeps the bill flat as you autoscale, because it doesn’t charge per host, container, or function.
✅ Lets unlimited basic users view dashboards, run queries, and set alerts for free, so you buy full platform seats only where they’re needed.
✅ Masks credit card and Social Security number patterns in logs by default, which lowers the risk of sensitive data sitting in your telemetry.
Cons:
❌ Past 100 GB on the free plan, a spike can pause ingest, and you lose platform access until you upgrade or the month resets.
❌ Full platform users cost $99 each on Standard beyond the first.
❌ Default retention is 8 days for traces on the Original option.
What Users Say
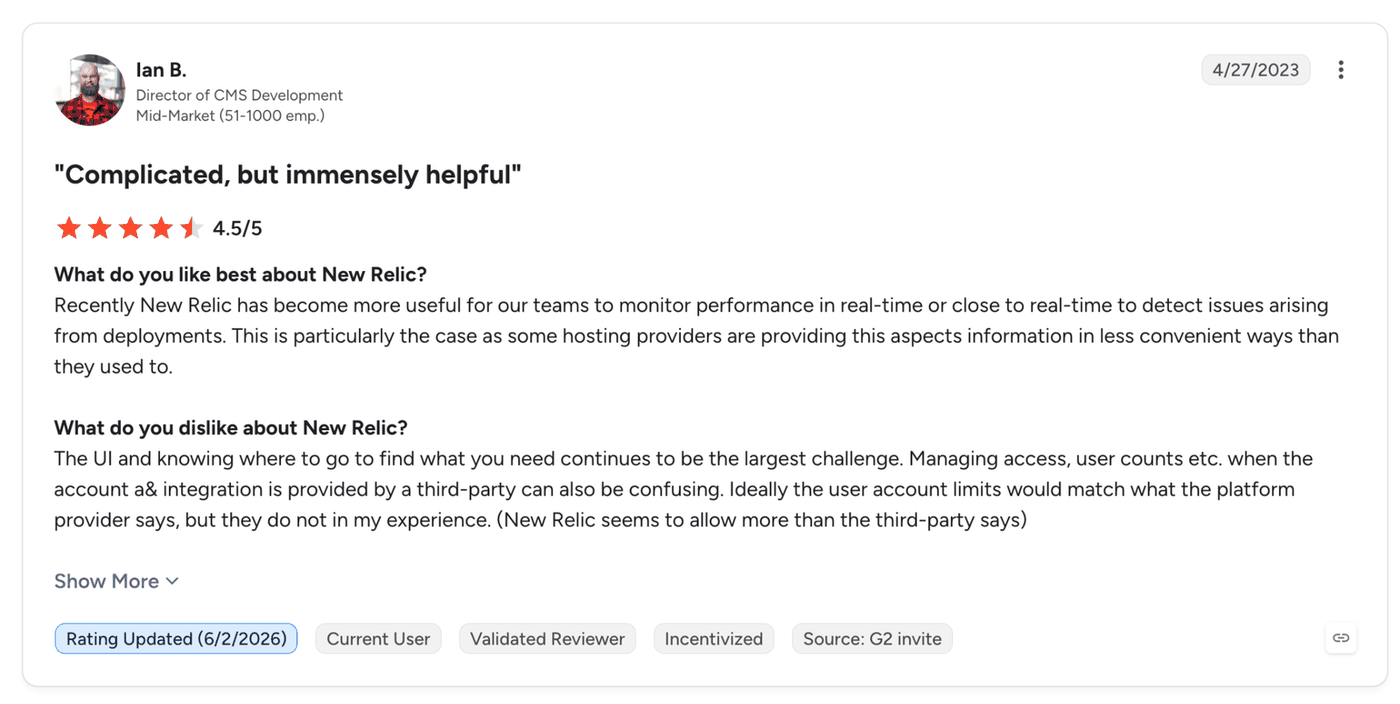
"Recently, New Relic has become more useful for our teams to monitor performance in real-time or close to real-time to detect issues arising from deployments." (Ian B., Director of CMS Development, G2)
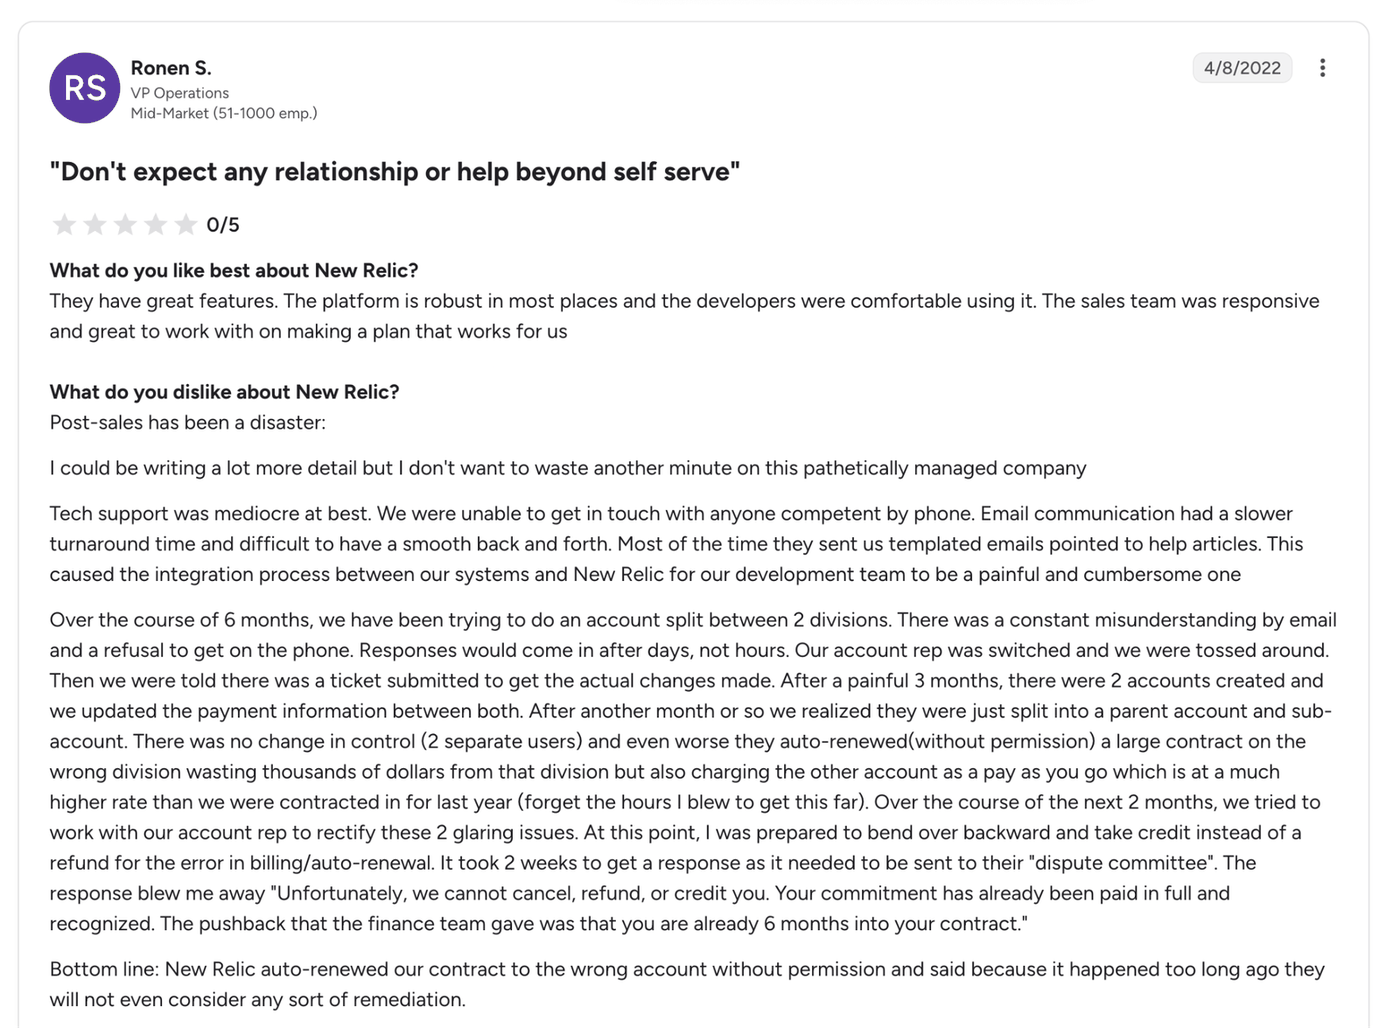
"Tech support was mediocre at best. We were unable to get in touch with anyone competent by phone." (Ronen S., VP Operations, G2)
Pricing
New Relic bills data at $0.40 per GB on Original and $0.60 on Data Plus, after 100 GB of free ingest. The Pro user tier is $349 per user per month billed annually.
Bottom Line
The bill follows ingest, so New Relic rewards organizations that can estimate their volume, and the 100 GB limit will test that estimate in your first month.
6. Splunk Observability Cloud, Best for Existing Splunk Customers
What it does: Splunk Observability Cloud monitors infrastructure, applications, and user interfaces, with live telemetry and alert correlation.
Best for: Organizations that use Splunk for logs or security and want observability from the same vendor.
Splunk says it can "spot anomalies in seconds, pinpoint root causes across any environment" and "correlate alert storms into a single actionable view," according to its product page. The same page mentions telemetry pipeline management and native OpenTelemetry support.
Splunk’s Observability Cloud service description lists SOC 2 Type II, HIPAA, and CSA STAR Level 1, though STAR Level 1 is a self-assessment rather than an audit, and the SOC 2 report is available from a sales rep on request.
Key Features
-
Alert correlation: Groups many related alerts into one view.
-
Telemetry pipeline management: Controls and routes telemetry before it reaches storage.
-
OpenTelemetry support: Ships the Splunk Distribution of the OpenTelemetry Collector.
Pros and Cons
Pros:
✅ Brings Splunk logs into the same view, since Log Observer Connect sits in the base Infrastructure tier.
✅ Adds network and uptime checks early, with Network Explorer and Synthetic Uptime Monitoring in that same $15 tier.
✅ Includes Always On Profiling with APM from the App & Infra tier, so code-level performance data needs no extra tool.
Cons:
❌ Billing is annual and per host, so cost scales with host count.
❌ APM and RUM carry separate meters ($55 per host, $14 per 10,000 sessions).
❌ I found no self-hosted option on Splunk's official pages for this product.
What Users Say
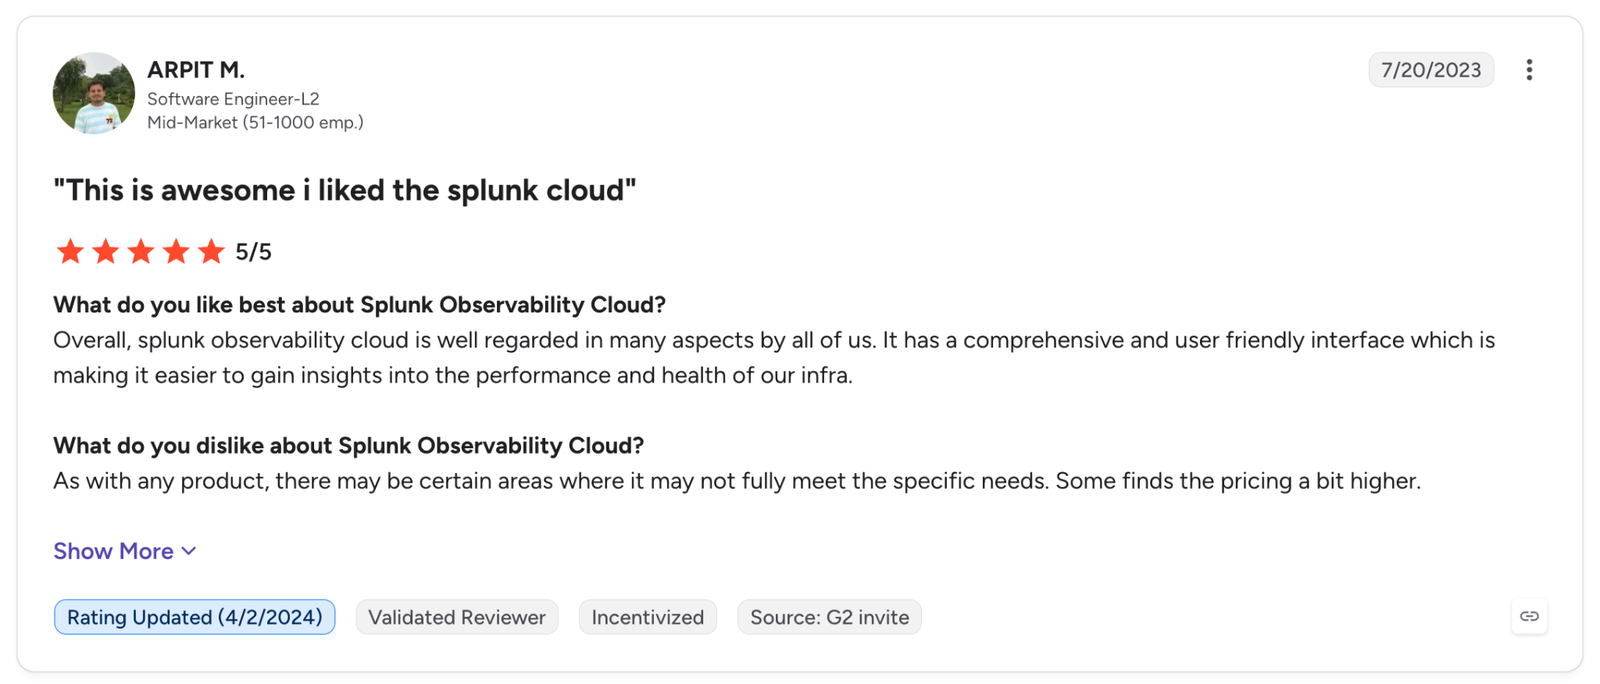
"It has a comprehensive and user-friendly interface which is making it easier to gain insights into the performance and health of our infra." (Arpit M., Software Engineer-L2, G2)
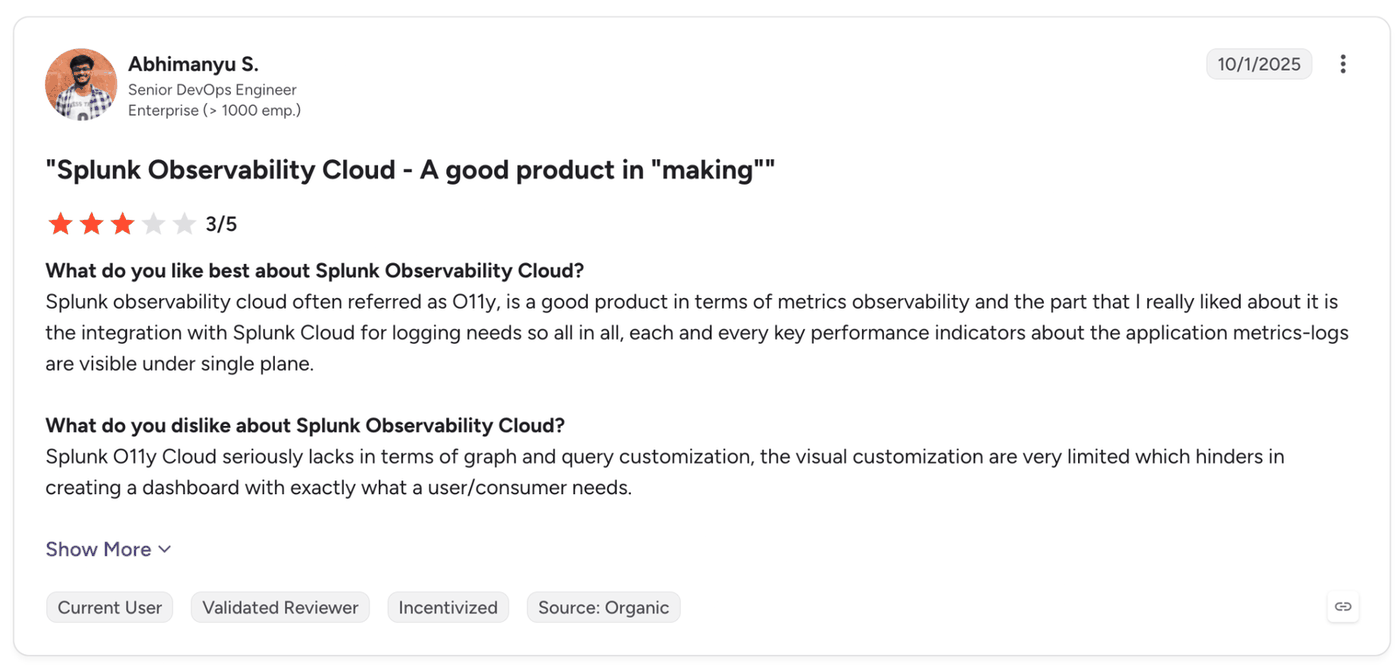
"Splunk O11y Cloud seriously lacks in terms of graph and query customization, the visual customization are very limited…" (Abhimanyu S., Senior DevOps Engineer, G2)
Pricing
Infrastructure is $15 per host per month billed annually, Application and Infrastructure is $60, and End-to-End is $75.
Bottom Line
Splunk Observability Cloud connects to Splunk Cloud for logging, so teams already on Splunk keep one vendor.
7. Elastic Observability, Best for Teams Already on Elasticsearch
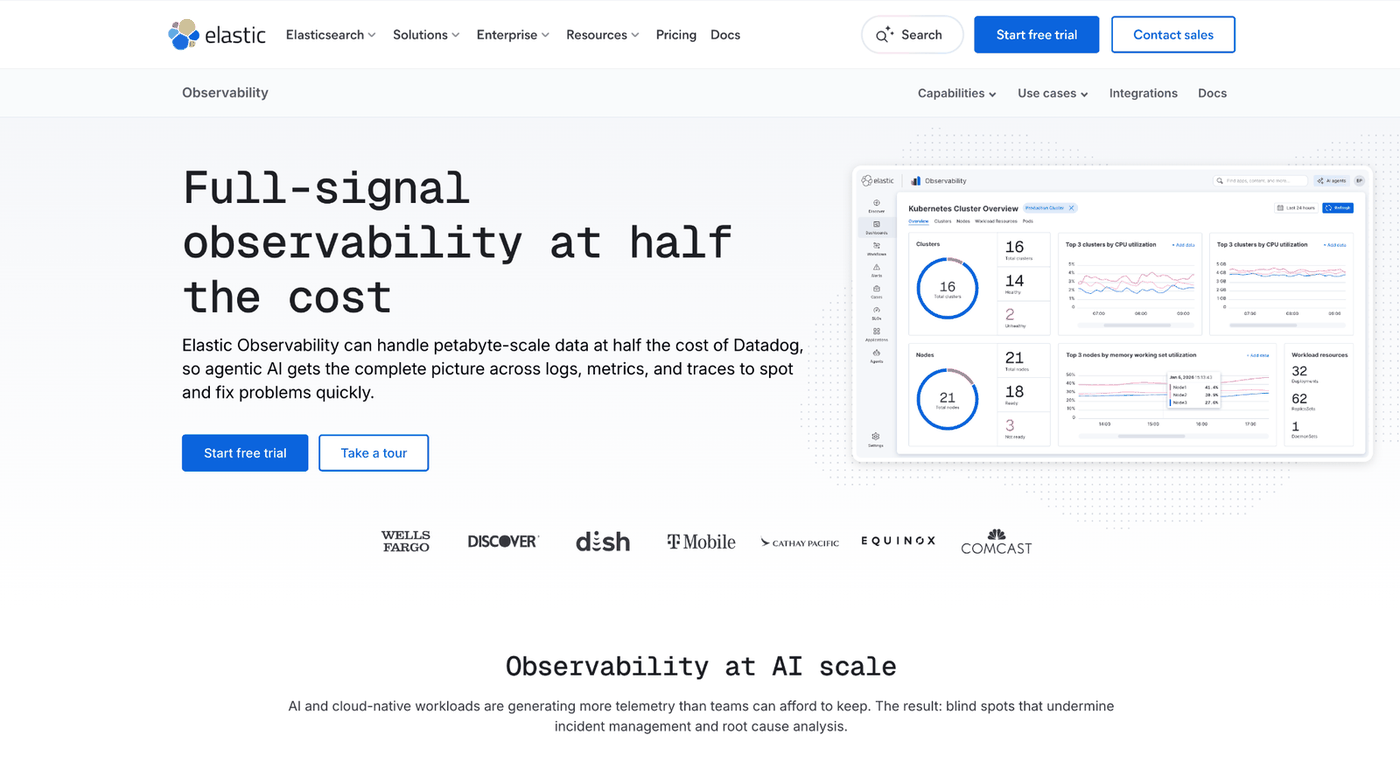
What it does: Elastic Observability extends Elasticsearch log search with metrics and traces.
Best for: Adding metrics and traces to log search that runs on Elasticsearch.
Elastic's docs describe the product as one that "combines logs, metrics, application traces, user experience data, and more." Its Streams feature ingests raw logs through a single endpoint.
On standards, its observability page points to native PromQL support and says the product is "built on OpenTelemetry (OTel) from the ground up."
Elastic deploys as Elastic Cloud Serverless, Elastic Cloud Hosted, or self-managed on your own hardware or Kubernetes.
Elastic's trust page shows SOC 2, ISO 27001, HIPAA, and FedRAMP without saying which deployment each one covers, so ask before you buy.
Key Features
-
Streams: Raw logs enter through a single endpoint without manual parsing pipelines, per Elastic's docs.
-
PromQL support: Lets Prometheus users query metrics with the syntax they know.
-
Deployment options: Runs as a managed cloud service or self-managed.
Pros and Cons
Pros:
✅ Removes cluster sizing on Serverless, so nobody on your team has to scale nodes when volume spikes.
✅ Backs the managed service with a 99.95% monthly uptime SLA.
✅ Reduces parsing work on the Complete tier, which adds AI-assisted pipelines and parsing for new log formats.
Cons:
❌ Three billing lines (ingest, retention, egress) need modeling before launch.
❌ Certifications are listed without a per-deployment mapping.
What Users Say
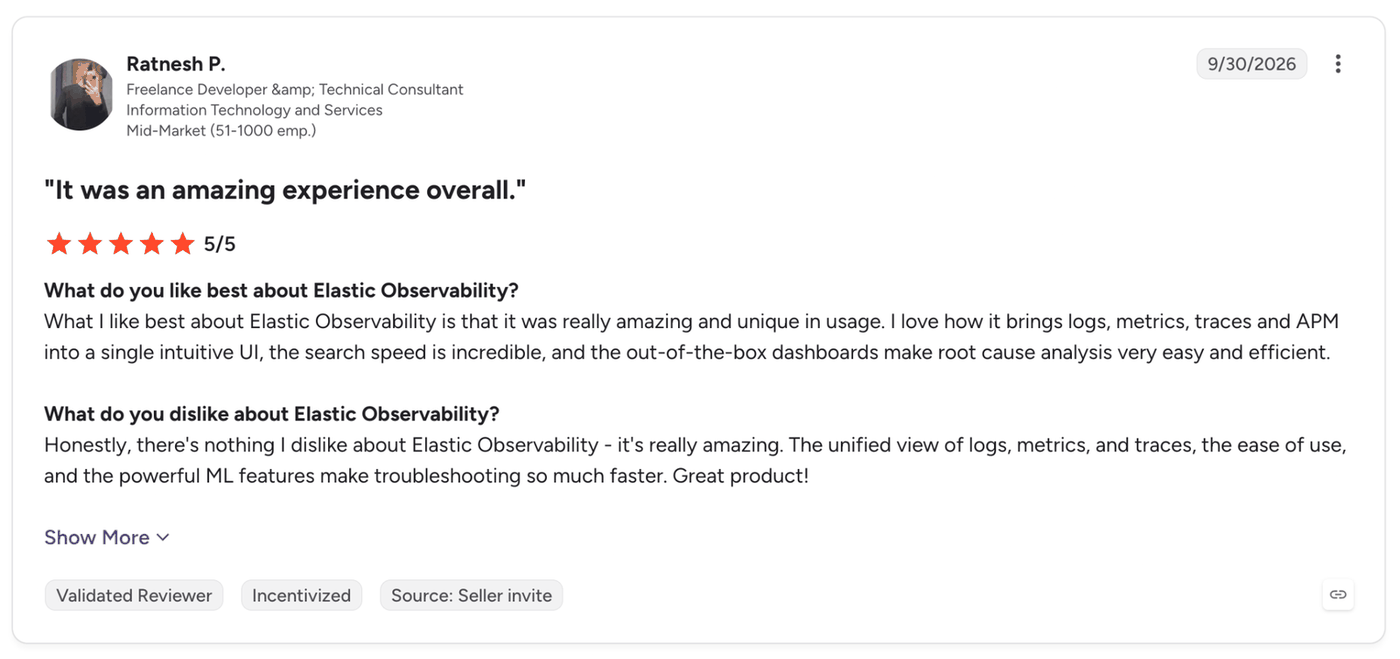
"I love how it brings logs, metrics, traces and APM into a single intuitive UI, the search speed is incredible, and the out-of-the-box dashboards make root cause analysis very easy and efficient." (Ratnesh P., Freelance Developer & Technical Consultant, G2)
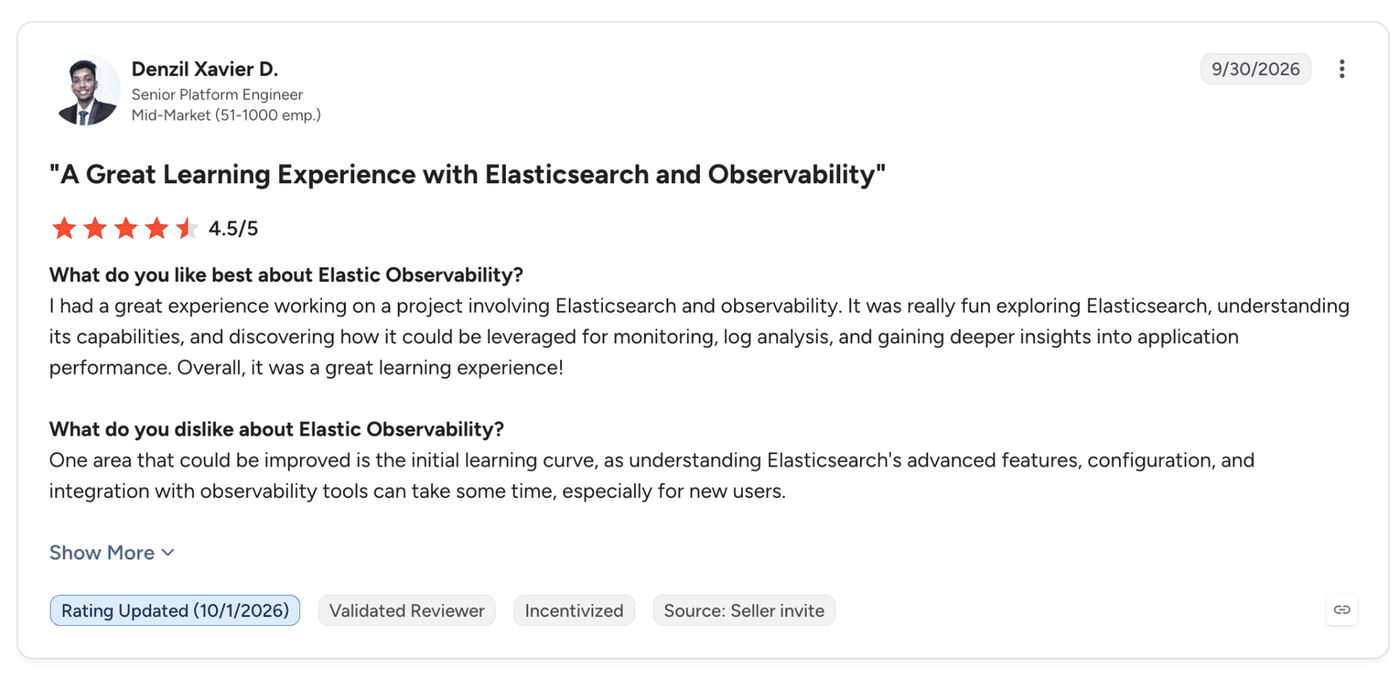
"…understanding Elasticsearch's advanced features, configuration, and integration with observability tools can take some time, especially for new users." (Denzil Xavier D., Senior Platform Engineer, G2)
Pricing
Serverless Logs Essentials starts at $0.07 per GB ingested. Complete is from $0.09 per GB for logs and traces and $0.023 for metrics.
Bottom Line
Elastic adds metrics and traces for shops that already search their logs in Elasticsearch. Model the three bill lines on your own volume first.
8. Honeycomb, High-Cardinality Debugging
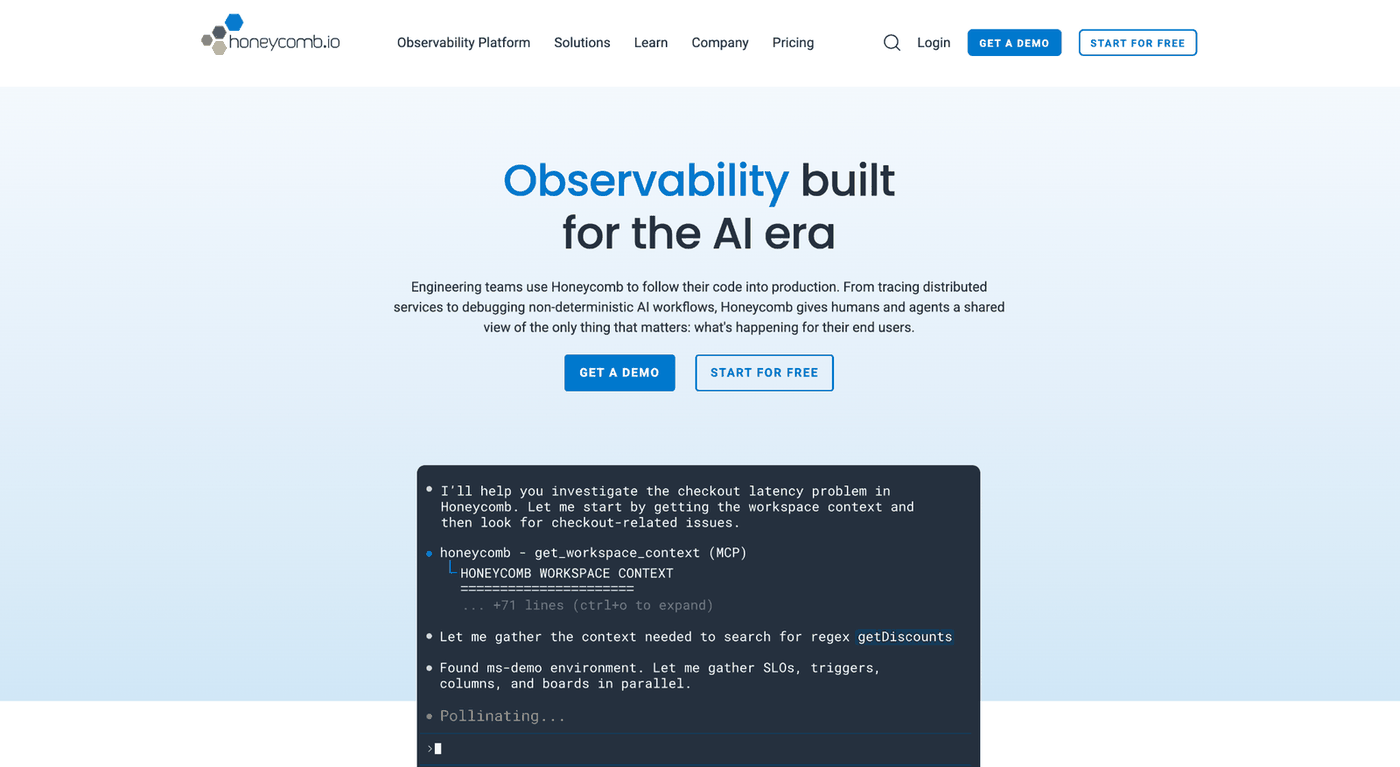
What it does: Honeycomb is an observability platform for debugging distributed systems.
Best for: Engineers who debug by slicing production events by fields such as user ID or request ID.
The pitch is to "investigate any production issue from the inside out," on what Honeycomb calls an "OpenTelemetry-native platform." Its docs also describe connecting AI agents to observability data through the Model Context Protocol.
Honeycomb is cloud-hosted, and its pricing page lists a Private Cloud option on Enterprise.
Key Features
-
High-cardinality queries: Filters and groups by high-cardinality fields without predefining dashboards, though one G2 reviewer calls the query language steep to learn.
-
Distributed tracing: Traces multi-agent conversations end-to-end, per Honeycomb's site.
-
Canvas AI Copilot: Included on the Free plan, with tracing and BubbleUp.
Pros and Cons
Pros:
✅ Doesn’t meter queries, so engineers can run as many exploratory queries as an incident needs without watching cost.
✅ Includes the Honeycomb MCP on the Free plan, so you can connect an AI coding agent to production data at $0.
✅ Adds SSO on Pro at $150 per month, so a security requirement doesn’t force you onto Enterprise.
Cons:
❌ Pro caps SLOs at 2 and triggers at 100, so heavier alerting needs Enterprise.
❌ Legacy plans at $1.30 per million events move to the Pro rate of $3.00 after the grace period ends on 31 December 2026.
❌ Private Cloud is available only on the Enterprise plan.
What Users Say
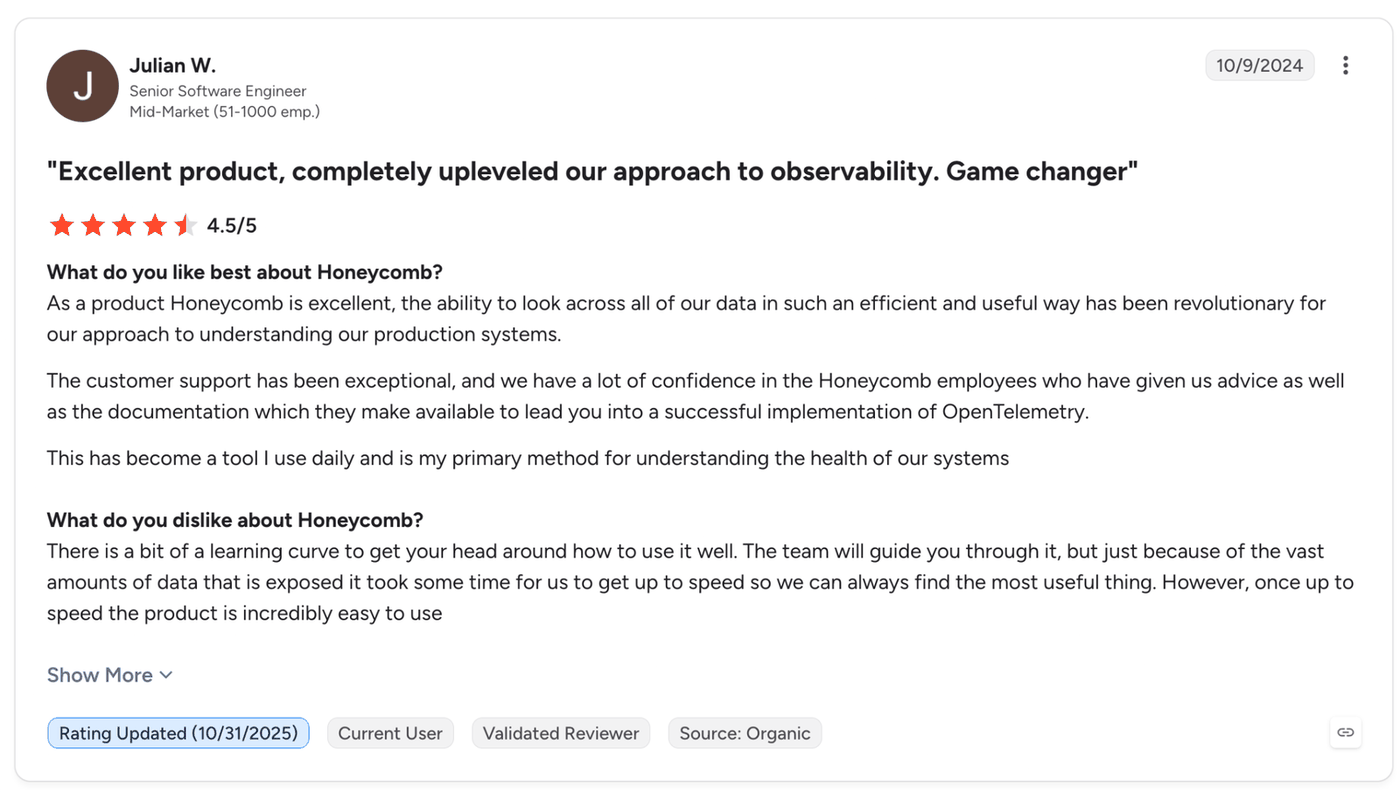
"…the ability to look across all of our data in such an efficient and useful way has been revolutionary for our approach to understanding our production systems." (Julian W., Senior Software Engineer, G2)
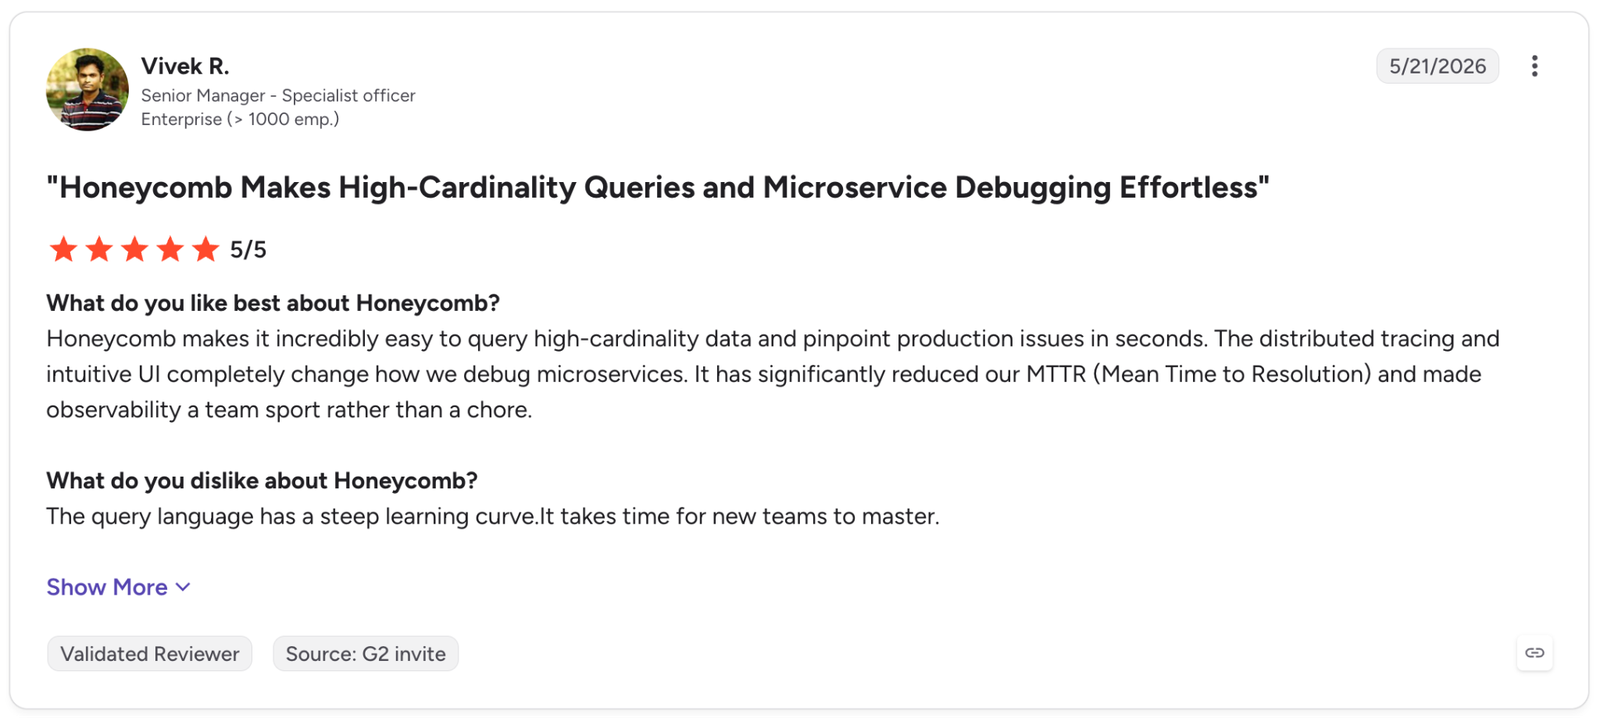
"The query language has a steep learning curve." (Vivek R., Senior Manager, G2)
Pricing
Pro starts at $150 per month with 100 triggers and 2 SLOs. Enterprise is custom, with 300 triggers and 100 SLOs. Free covers up to 20M events per month.
Bottom Line
Honeycomb pays off for engineers who keep asking new questions of live systems, whereas a team that mainly wants fixed dashboards may use few of its features.
9. OpenObserve, A Self-Hosted ELK Replacement
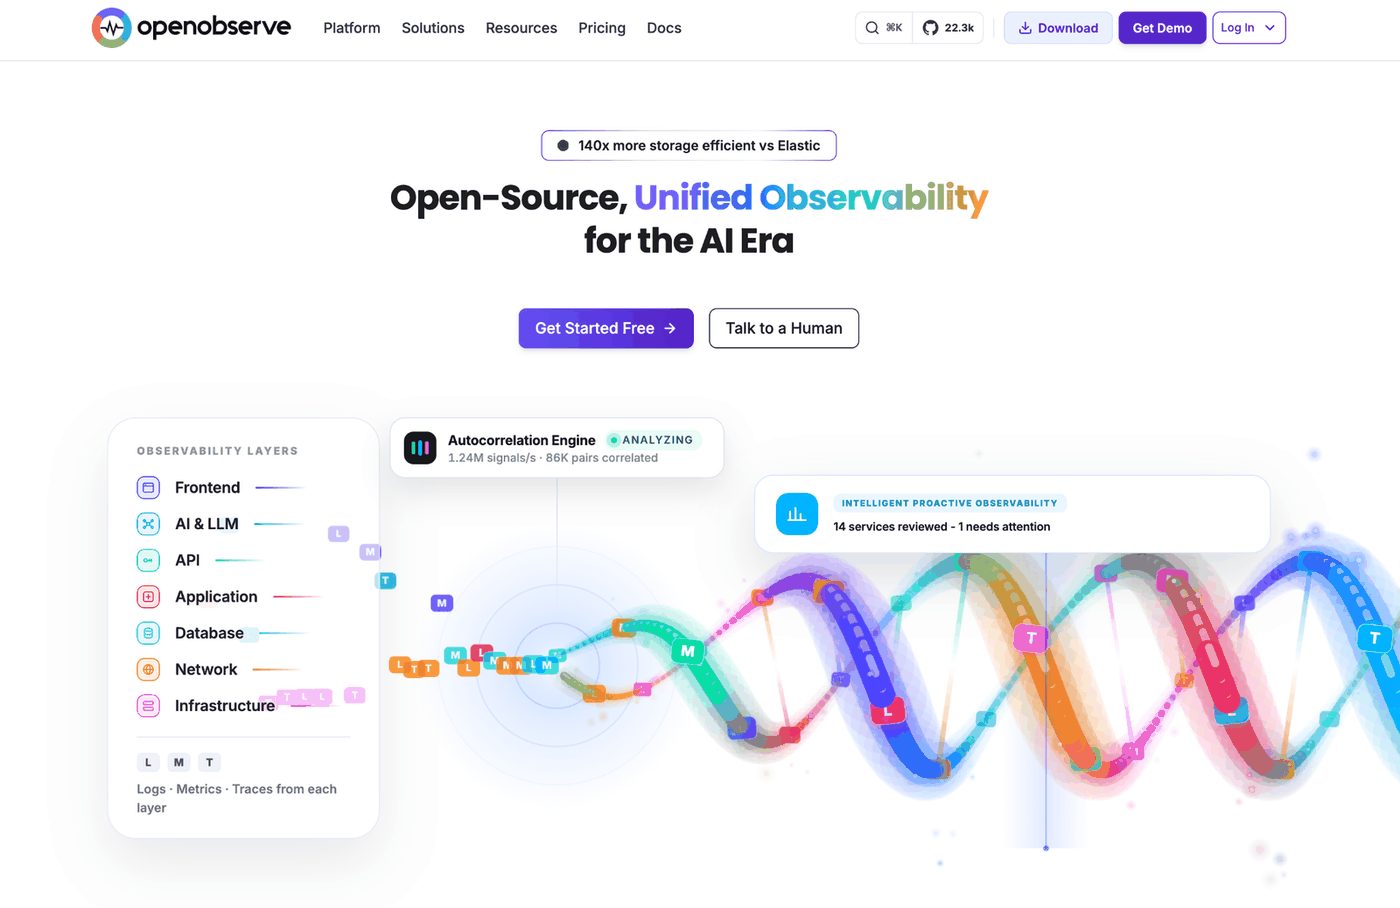
What it does: OpenObserve is a self-hostable platform for logs, metrics, and traces, written in Rust.
Best for: Teams that want to run their own platform in place of an ELK stack.
OpenObserve's docs call it "an open-source, unified, petabyte-scale observability platform for logs, metrics, and traces, built in Rust, with SQL and PromQL." It's licensed under AGPL-3.0, and its Trust Center reports SOC 2 Type II, SOC 2 Type I, and ISO 27001 as attained.
For instrumentation, the docs add OBI, an eBPF zero-code option that captures traces and metrics with no SDK. Deployment covers local install, Docker, Kubernetes, and OpenObserve Cloud.
Joins and nested subqueries are among the queries OpenObserve's cache docs single out, saying "very complex queries may not be eligible for cache reuse yet."
Key Features
-
SQL and PromQL queries: Searches logs with SQL and metrics with PromQL in one interface, though joins and nested subqueries may skip the cache.
-
OBI (eBPF instrumentation): Captures traces and metrics through eBPF with no SDK.
-
Deployment options: Runs self-hosted or as OpenObserve Cloud.
Pros and Cons
Pros:
✅ Keeps metrics for 15 months by default on Cloud, so long-term trends are available without extra retention fees.
✅ Charges no per-seat or per-host fees, so cost follows data volume alone.
✅ Lets you move between Cloud and self-hosted at any time, so the deployment choice isn’t permanent.
Cons:
❌ Joins and nested subqueries may not reuse the cache, per OpenObserve's cache docs.
❌ Cloud retains non-metric data for 30 days by default, with extra retention at $0.02 per GB per 30 days.
❌ Has about 21k GitHub stars, against about 66k for Prometheus and about 77k for Grafana (GitHub, 9 October 2026).
What Users Say
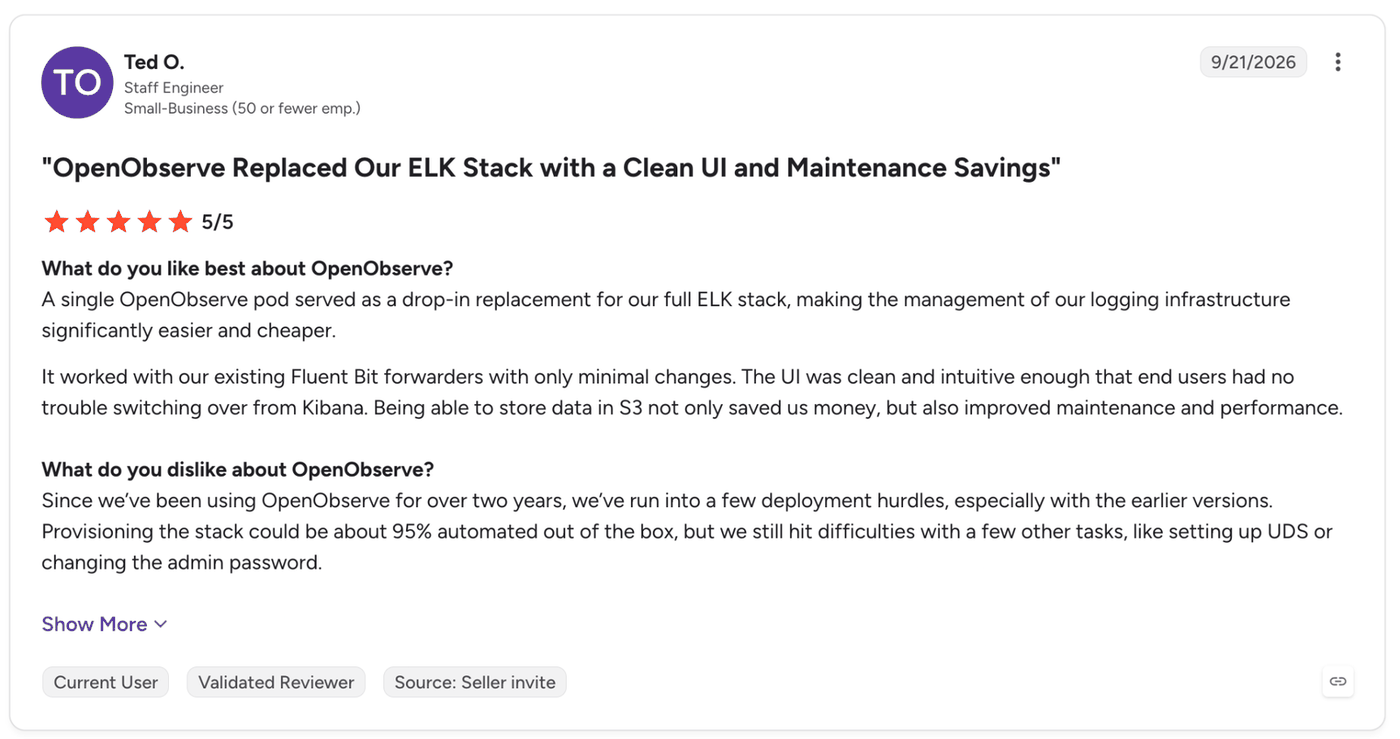
"A single OpenObserve pod served as a drop-in replacement for our full ELK stack, making the management of our logging infrastructure significantly easier and cheaper." (Ted O., Staff Engineer, G2)
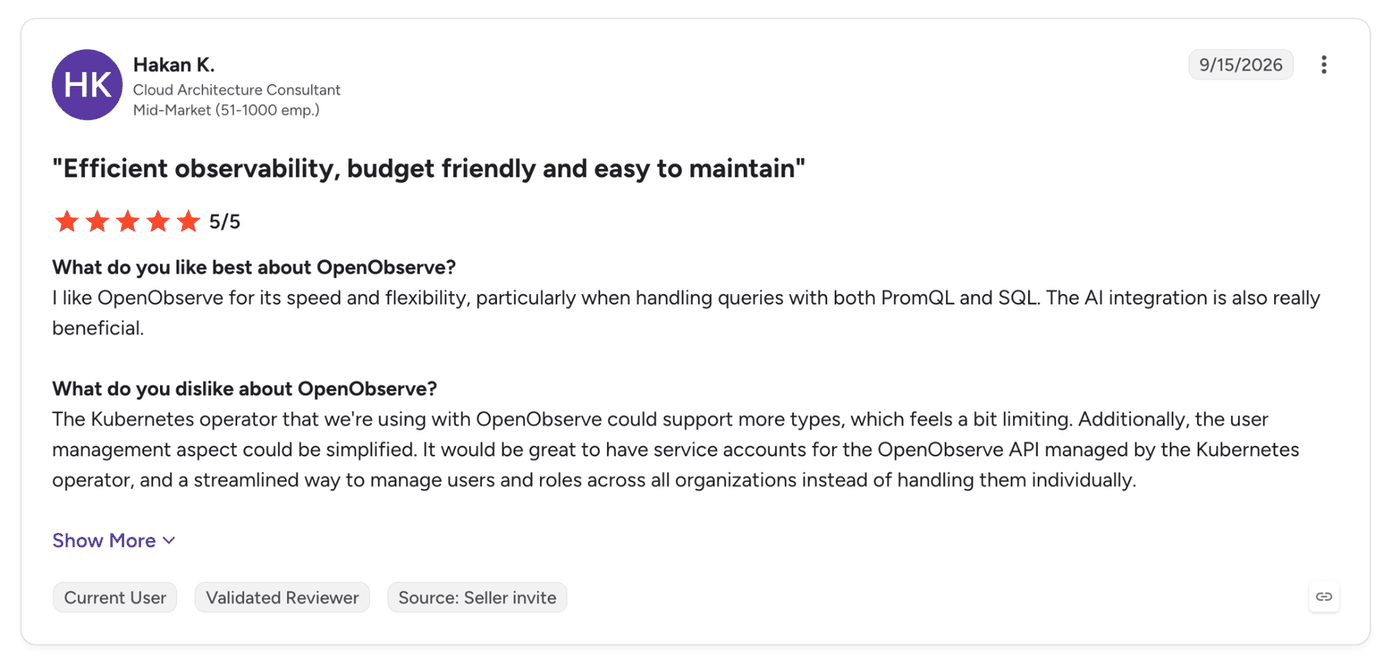
"The Kubernetes operator that we're using with OpenObserve could support more types, which feels a bit limiting." (Hakan K., Cloud Architecture Consultant, G2)
Pricing
Cloud Professional is $0.50 per GB ingested plus $0.01 per GB queried, with a 14-day free trial. Enterprise Cloud is custom. Open Source self-hosted is free.
Bottom Line
OpenObserve suits a team that owns its infrastructure and wants a self-hosted ELK replacement. Test your resource-intensive queries before you migrate.
10. Prometheus, Open-Source Kubernetes Metrics
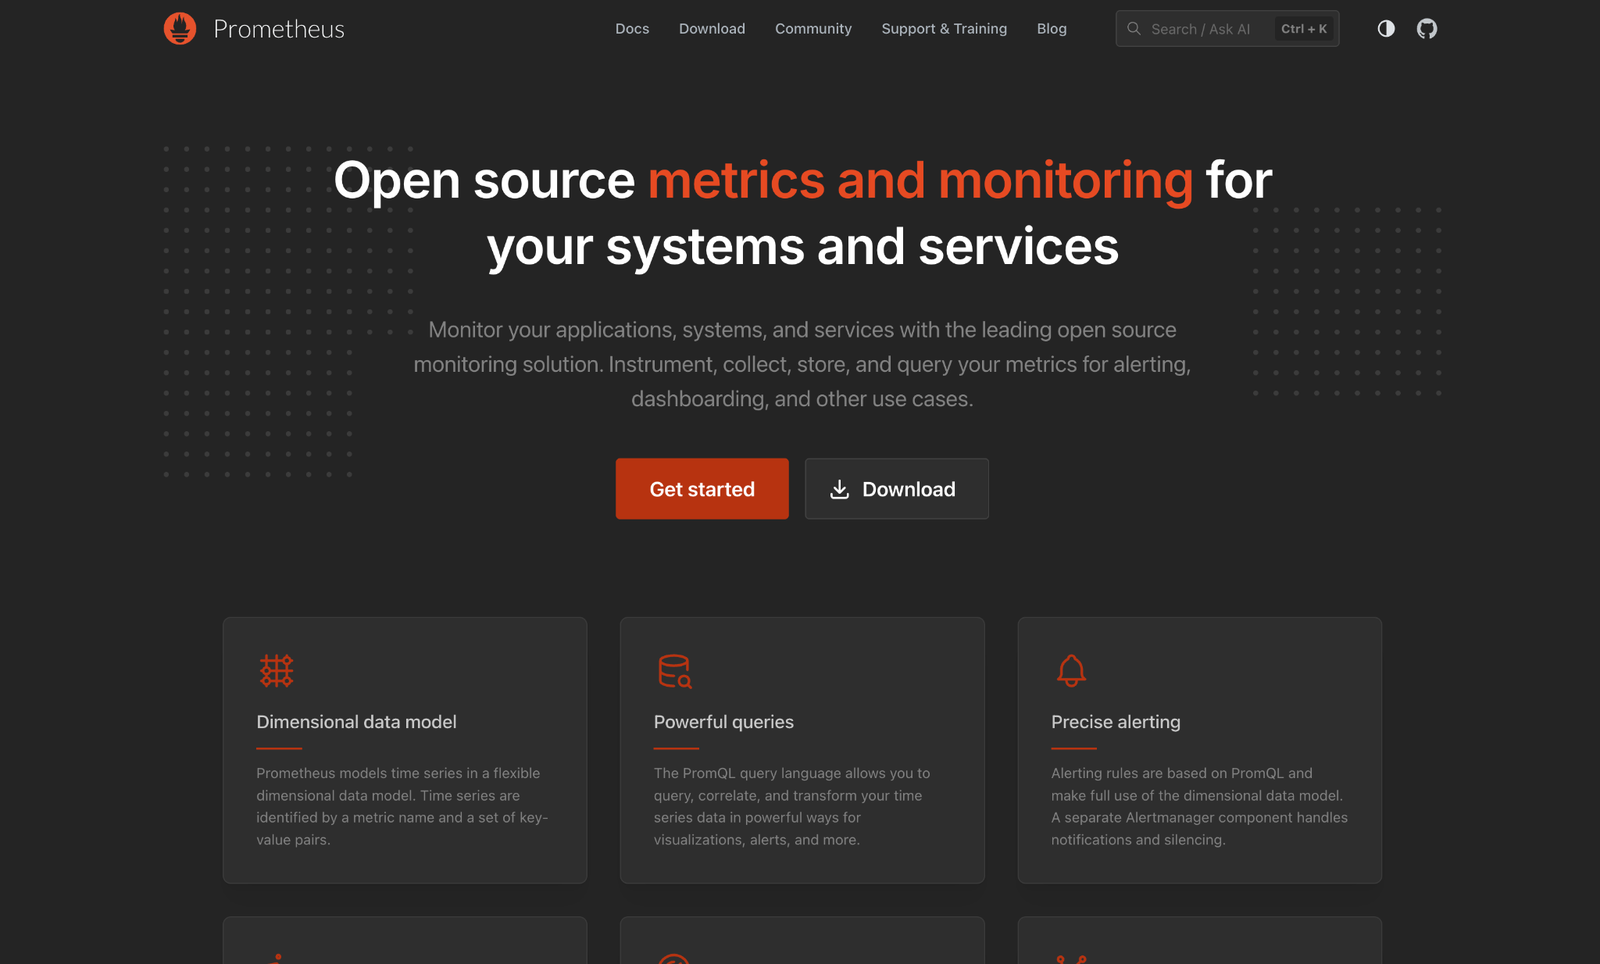
What it does: Prometheus is an open-source systems monitoring and alerting toolkit originally developed at SoundCloud.
Best for: Kubernetes-first setups that need metrics collection and alerting at no license cost.
Prometheus describes its model as "multi-dimensional" time series identified by metric name and key-value pairs, queried with PromQL. It runs as autonomous single servers with no reliance on distributed storage.
It's Apache 2.0 licensed and part of the Cloud Native Computing Foundation, and Prometheus's own FAQ recommends Grafana for dashboards.
The Prometheus project itself provides self-hosted software only. Local storage "is not clustered or replicated," so the storage docs say to manage it "like any other single node database." Retention defaults to 15 days.
The overview adds another boundary, saying "If you need 100% accuracy, such as for per-request billing, Prometheus is not a good choice." For OpenTelemetry users, Prometheus also receives OTLP over HTTP, but the receiver is disabled by default and covers metrics only.
Key Features
-
PromQL: Queries and aggregates time series across labels.
-
Alertmanager: Routes alerts fired from query results.
-
OTLP receiver: Reads OpenTelemetry metrics once you enable the flag, and metrics only.
Pros and Cons
Pros:
✅ Finds targets automatically through service discovery, so new Kubernetes pods get scraped without manual config.
✅ Reuses what you already run, with exporters for HAProxy, StatsD, and Graphite and client libraries for your own code.
✅ Covers short-lived batch jobs through its Pushgateway, so jobs that finish before a scrape still report.
Cons:
❌ Local storage has no clustering or replication, so long-term storage needs an add-on.
❌ Handles metrics only; logs and traces go to Loki, Tempo, or another tool.
❌ Prometheus's own FAQ recommends Grafana for dashboards, so you'll probably run both.
What Users Say
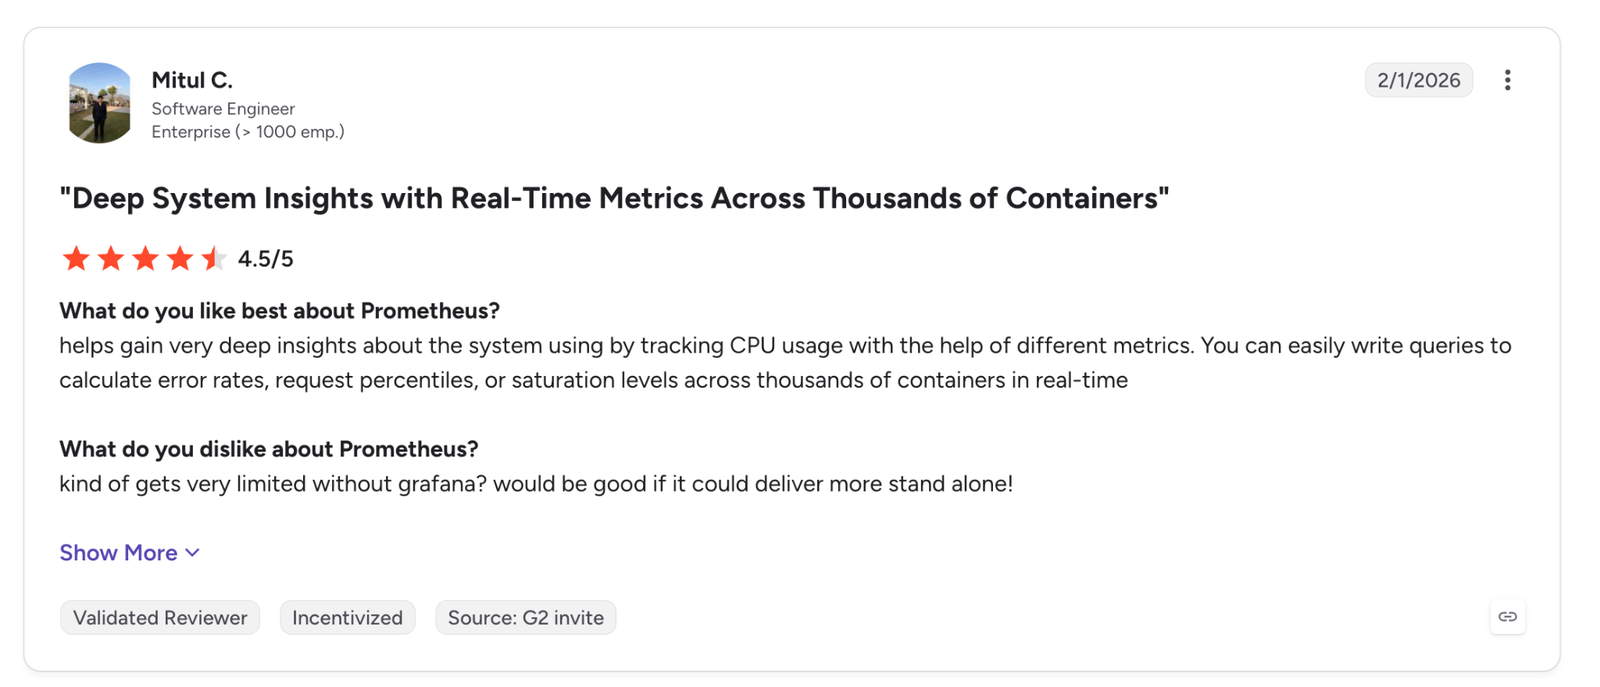
"You can easily write queries to calculate error rates, request percentiles, or saturation levels across thousands of containers in real-time." (Mitul C., Software Engineer, G2)
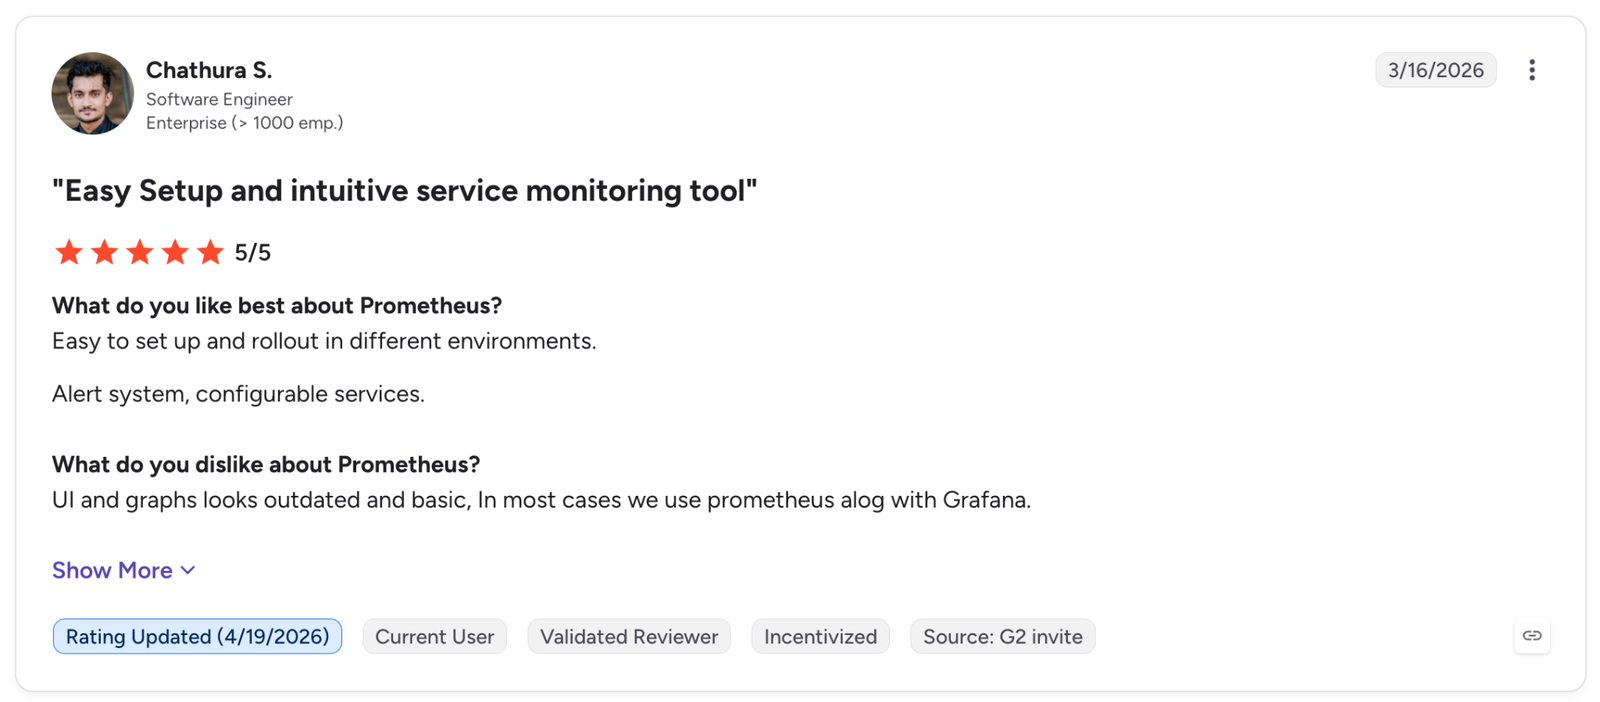
"UI and graphs looks outdated and basic…" (Chathura S., Software Engineer, G2)
Pricing
Prometheus is free. It has no pricing page, and the project overview describes it as open source.
Bottom Line
Prometheus covers Kubernetes infrastructure metrics without a license bill, with storage and dashboards left for you to plan from the start.
11. Middleware, Small Teams on Per-GB Pricing
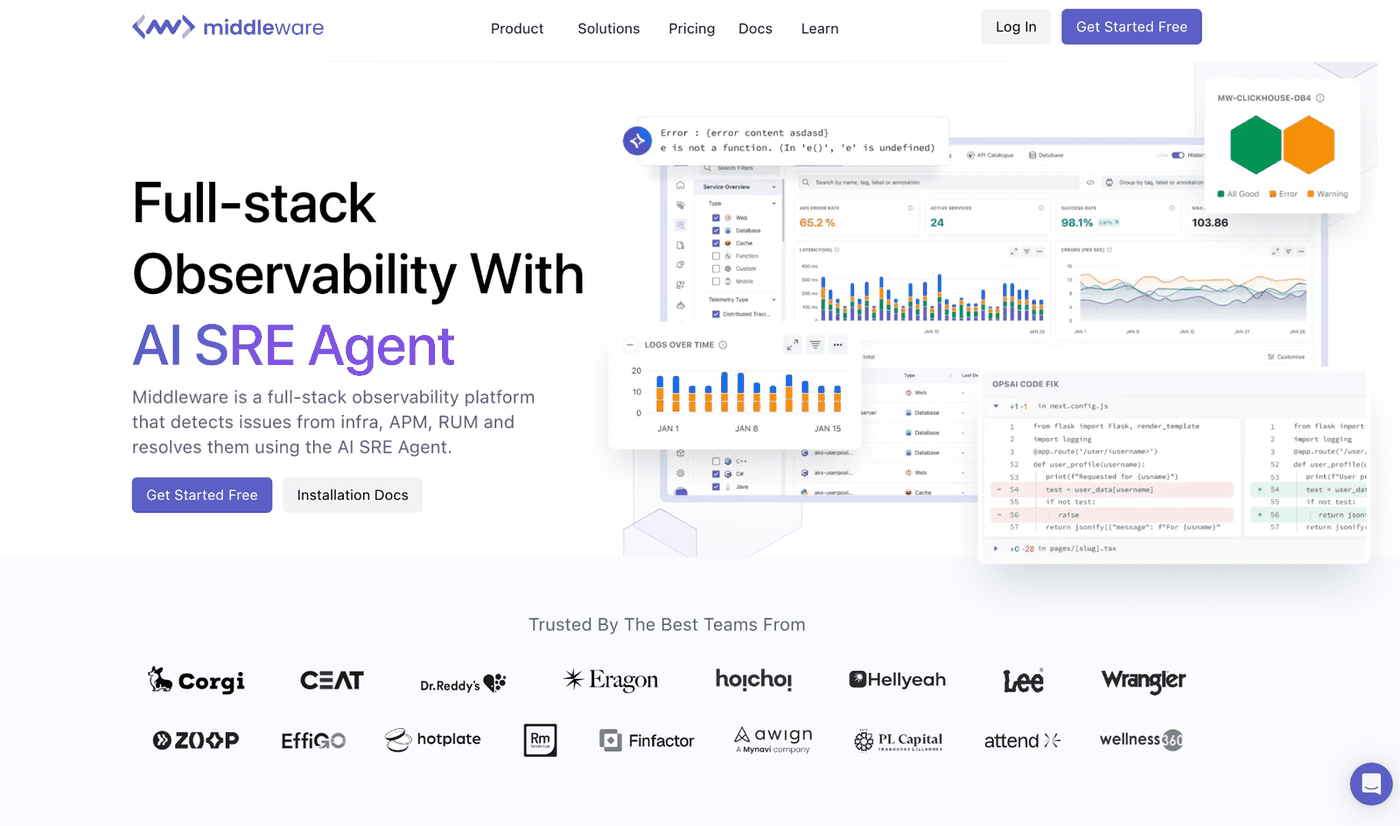
What it does: Middleware is a full-stack cloud observability platform that collects telemetry from front end to back end.
Best for: Small teams that want a free tier and one per-GB rate for metrics, logs, and traces.
Middleware lists infrastructure monitoring, AI log insights, and an OpsAI SRE agent that detects, debugs, and auto-fixes issues. Its homepage says it "detects issues from infra, APM, RUM and resolves them using the AI SRE Agent."
Middleware is SaaS by default, with a custom BYOC (bring your own cloud) option, and its OpenTelemetry docs describe configuring the OpenTelemetry Collector Contrib distribution with the platform.
On compliance, its security page shows SOC 2, ISO 27001, HIPAA, and GDPR badges but gives no audit dates or scope, so ask for the reports.
Key Features
-
Infrastructure and APM: Monitors infrastructure and applications.
-
AI log insights: Summarizes log patterns.
-
OpsAI agent: Detects issues across the application and infrastructure layers it monitors, per Middleware's site.
Pros and Cons
Pros:
✅ Bills on data actually stored, so logs you drop in the ingestion pipeline cost nothing.
✅ Detects errors for free, and you pay token-based fees only when you use root cause analysis or automated fixes.
✅ Cuts lock-in, because you can cancel anytime and download your data for 30 days afterward.
Cons:
❌ Free Forever keeps data for 14 days.
❌ Some integrations need manual configuration, per a G2 reviewer.
❌ No dates or scope appear beside its compliance badges.
❌ Smaller public presence than the established vendors on this list.
What Users Say
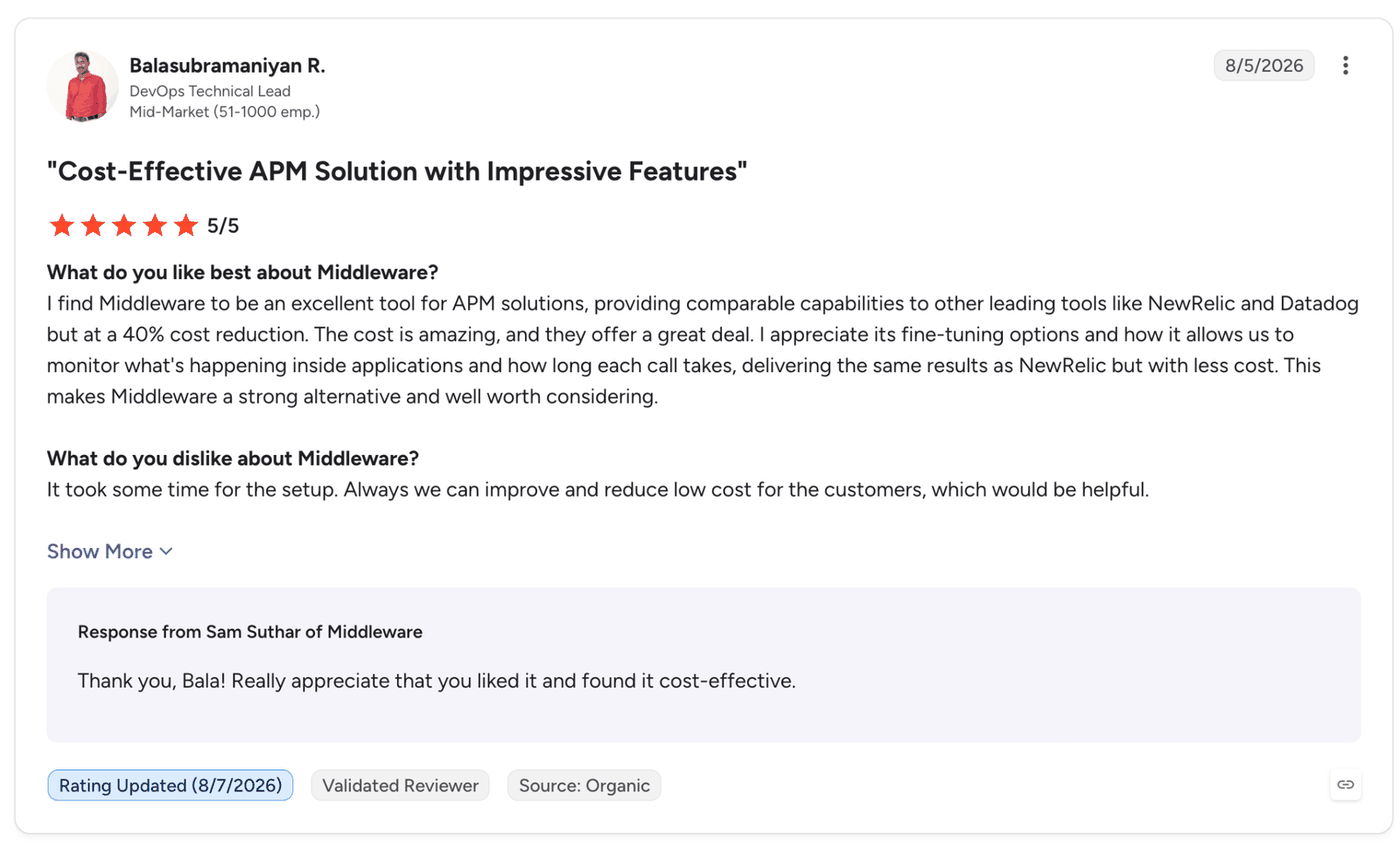
"I appreciate its fine-tuning options and how it allows us to monitor what's happening inside applications and how long each call takes…" (Balasubramaniyan R., DevOps Technical Lead, G2)
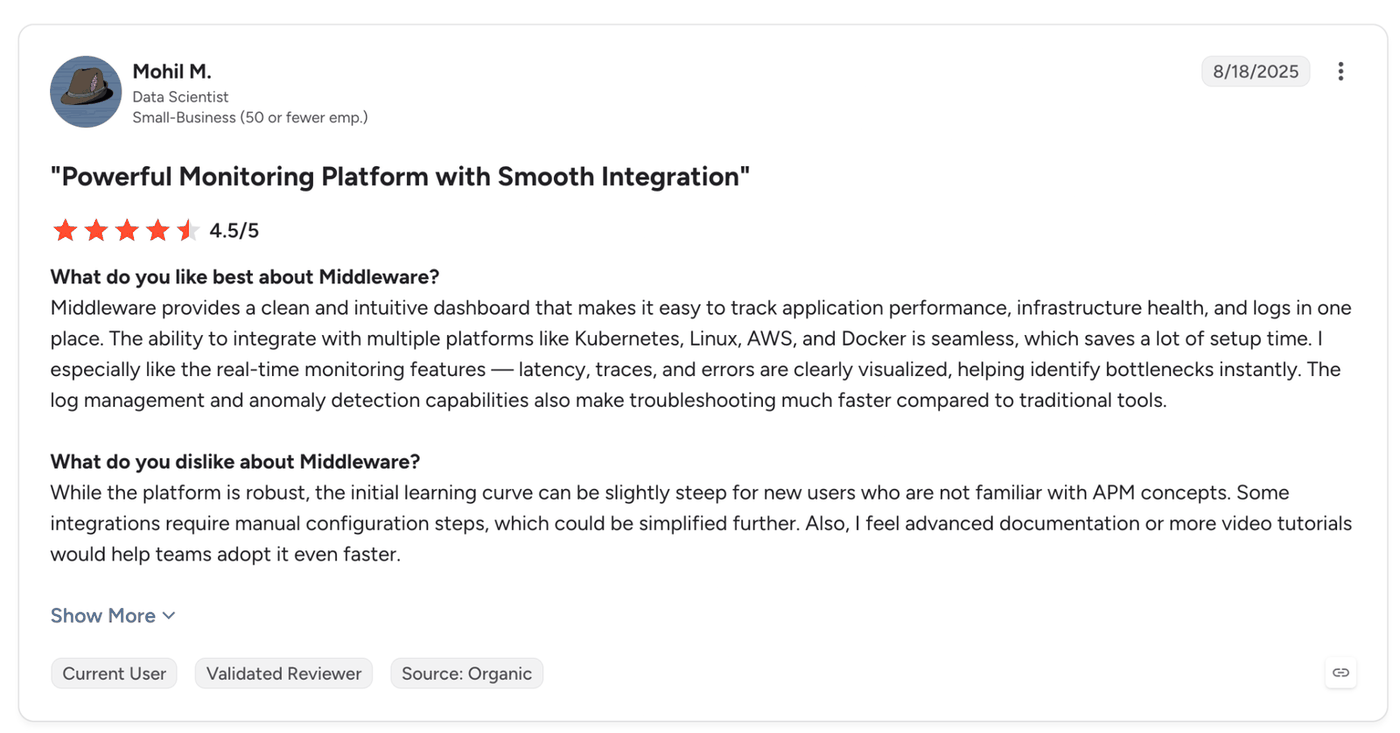
"Some integrations require manual configuration steps, which could be simplified further." (Mohil M., Data Scientist, G2)
Pricing
Pay As You Go is $0.30 per GB, and BYOC is custom. Free Forever is $0 for up to 100 GB.
Bottom Line
For a small team that wants one per-GB rate across metrics, logs, and traces, Middleware is a reasonable first platform. Ask for the compliance reports before you commit.
12. Langfuse, Open-Source LLM Application Tracing
What it does: Langfuse is an open-source AI engineering platform for LLM and agent applications.
Best for: LLM apps where you want to host the tooling yourself.
Langfuse's docs describe tracing for LLM calls and multi-turn sessions. They also cover prompt management with version control and evaluation through LLM-as-a-judge, user feedback, and datasets.
Its security page says Langfuse runs annual SOC 2 Type II and ISO 27001 audits and is GDPR compliant. Cloud also offers a HIPAA-ready region, with reports available on request.
You can use Langfuse Cloud or run it yourself with Docker Compose or Kubernetes (Helm). The core is MIT licensed. The company joined ClickHouse and says Langfuse will stay open source and self-hostable.
Langfuse takes OTLP over HTTP only, since gRPC "is not supported yet," and a self-hosted install also needs Postgres, Redis or Valkey, ClickHouse, and S3 or blob storage.
Key Features
-
LLM tracing: Records calls and multi-turn sessions as traces, over OTLP on HTTP only, since gRPC isn't supported yet.
-
Prompt management: Versions and deploys prompts without code changes.
-
Evaluation: Scores outputs through LLM-as-a-judge evaluators and user feedback, with datasets for repeat runs.
Pros and Cons
Pros:
✅ Gives every plan the full feature set (tracing, prompts, evals, datasets, playground), so the free Hobby tier tests everything before you pay.
✅ Keeps cost flat as the team grows, since unlimited users start on the $29 Core plan.
✅ Offers discounts on Core and Pro for startups, education, and open-source projects.
Cons:
❌ OTLP over gRPC is unsupported.
❌ Its Pipecat and LiveKit guides don't mention audio capture or simulated test calls.
❌ A self-hosted deployment runs on Postgres, Redis or Valkey, ClickHouse, and S3 or blob storage.
What Users Say
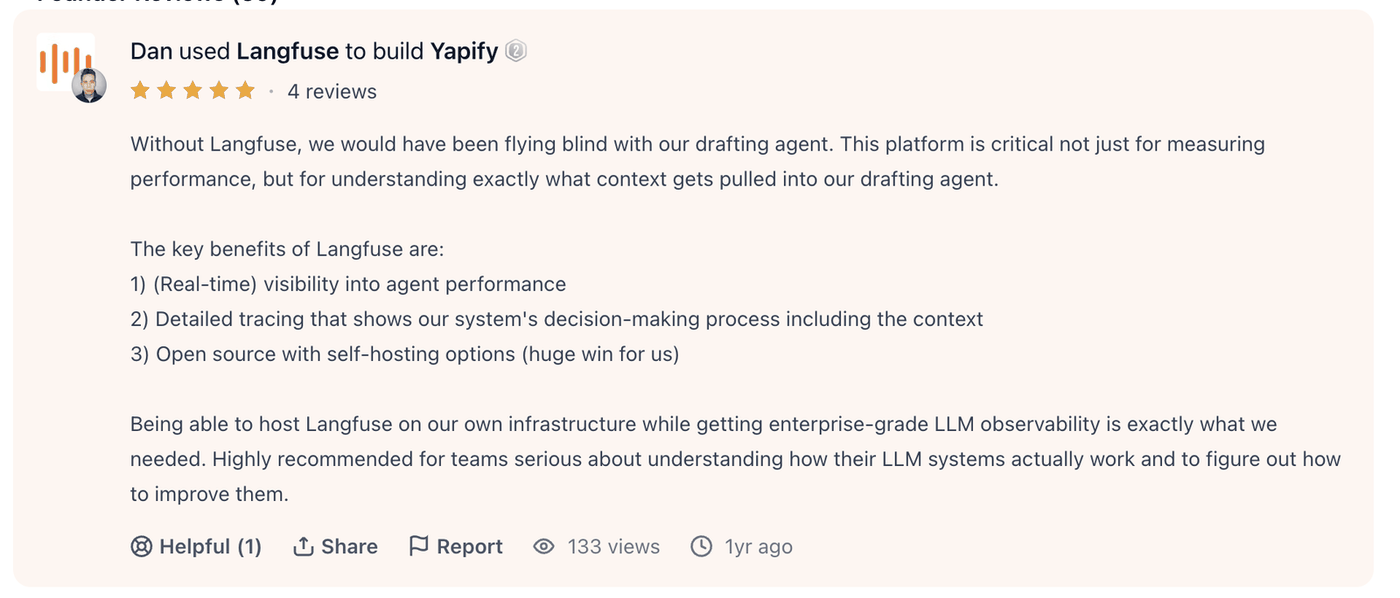
"Without Langfuse, we would have been flying blind with our drafting agent." (Dan, Yapify, Product Hunt)
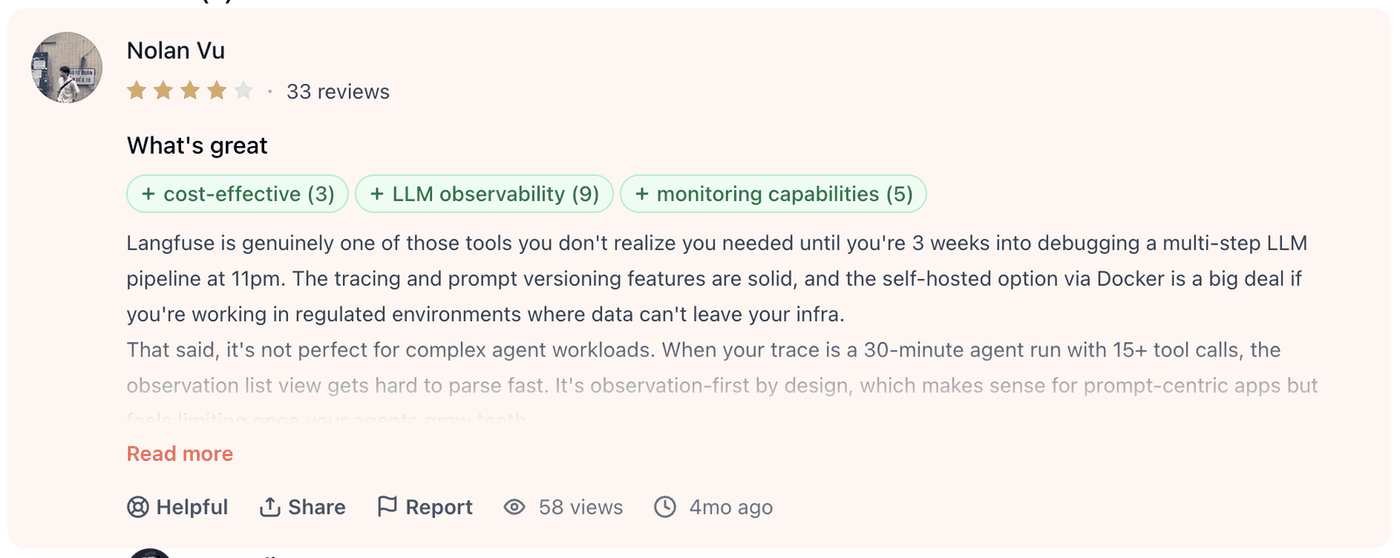
"When your trace is a 30-minute agent run with 15+ tool calls, the observation list view gets hard to parse fast." (Nolan Vu, Product Hunt)
Pricing
Core is $29 per month, Pro is $199 per month, and Enterprise is from $2,499 per month. Hobby is free with 50k units. Self-hosted Open Source is $0.
Bottom Line
Langfuse works well once your product is an LLM app and you want the traces in a tool you control, with a general platform covering servers and databases.
Open-Source Observability Platforms
Prometheus, Grafana, and OpenObserve are ranked above, and OpenTelemetry is the standard they share. Here's how the pieces connect.
Prometheus (Apache 2.0) collects metrics. Grafana (AGPL-3.0) builds dashboards and alerts over multiple data sources. OpenObserve (AGPL-3.0) stores all three signals in one engine. Langfuse (MIT) joins them for LLM workloads.
OpenTelemetry is the vendor-neutral standard for generating telemetry, and the platforms here accept it. Prometheus uses an OTLP receiver, and Grafana Cloud and Elastic offer native OTLP ingest. Honeycomb is OpenTelemetry-native, and Langfuse has its own OTLP endpoint.
The tradeoff is operations work. Self-hosted tools carry no license fee, and your team runs, patches, and backs them up.
AI and LLM Workload Observability
Host dashboards track resource and request metrics. Several platforms now include a layer for this.
Datadog's Agent Observability monitors and evaluates LLM-powered applications, and New Relic's AI monitoring tracks tokens, errors, and cost per model. Splunk prices a separate Agent Observability product.
Dynatrace added AI observability by completing its Arize acquisition on 1 October 2026, and Langfuse covers tracing and evals for LLM apps.
Those platforms target LLM applications in general. Cekura focuses on voice and chat agents. It simulates callers before launch and scores live production calls. Other tools on this list also trace voice pipelines; Langfuse, for example, has Pipecat and LiveKit integrations.
For more depth, Cekura's guides on LLM monitoring and agent performance monitoring explain the metrics, and its AI agent evals guide explains testing. Cekura doesn't replace infrastructure telemetry, so run it alongside one of the general platforms.
What to Look for in an Observability Platform
Start with deployment and portability. Some data has to stay in your network. Among the platforms here, Grafana, Prometheus, OpenObserve, Langfuse, and Elastic run self-hosted, while Dynatrace Managed and Datadog's BYOC Logs cover narrower cases.
Next, check whether the tool accepts OpenTelemetry, so you can switch later without re-instrumenting.
Then check the meter. Per-host billing (Datadog, Dynatrace, Splunk) ties cost to host count, and per-GB billing (New Relic, Elastic, OpenObserve, Middleware) ties it to data volume.
Retention matters too. Defaults include 1 day of metrics on Datadog Free, 8 days of APM data on New Relic's Original option, 14 days on Middleware's free tier, and 15 days on Prometheus, so a regression that took three weeks to appear can fall outside the window.
How to Choose an Observability Platform in 2026 (5 Steps)
Work through these steps in order.
-
List your telemetry. Write down which of logs, metrics, traces, and events you collect today and what volume each produces per day.
-
Pick the deployment. Decide whether data may leave your network. That removes tools that are SaaS-only for the signals you need.
-
Estimate the bill. Price your own volume against each meter, including retention and egress.
-
Check the limits. Read the main limitation in each tool above against your stack.
-
Trial with production traffic. Run two finalists on one live service for a full billing cycle.
Which Observability Platform Should You Choose in 2026?
Pick by what you run, who operates it, and which billing model your finance team will accept.
Choose Cekura if you
-
Operate voice or chat AI agents and need simulation before launch and call monitoring after.
-
Need to find the exact step where a failed call broke, from speech recognition to the tool call, with Slack or webhook alerts.
Choose Datadog or Dynatrace if you
-
Want one commercial vendor for the whole stack and can model per-host cost.
-
Manage a large hybrid estate and want the platform to identify root causes.
Choose Grafana or Prometheus if you
-
Want open-source tools you can self-host and audit.
-
Have engineers who can operate the storage layer, including upgrades and backups.
Choose OpenObserve if you
- Want one self-hosted engine for your telemetry, queried with SQL.
Choose New Relic or Middleware if you
- Prefer usage-based billing with a free tier to start.
Choose Honeycomb if you
- Debug distributed systems and want to query by high-cardinality fields.
Choose Splunk or Elastic if you
- Already use Splunk or Elasticsearch and want observability from the same vendor.
Choose Langfuse if you
- Build an LLM application and want self-hostable tracing, prompts, and evals.
Skip this category entirely if
-
You operate a single small service, and the monitor your cloud provider includes is enough.
-
Your team has no one assigned to read dashboards or answer alerts.
Final Verdict
Each environment needs its own pick. If you run voice or chat AI agents, Cekura is my recommendation, because it shows what host dashboards cannot capture and sits beside whichever general platform you run.
Among the general platforms, Datadog covers infrastructure, APM, and logs in one product, Dynatrace adds Davis AI root-cause analysis, and Grafana with Prometheus covers dashboards and metrics under open-source licenses.
For narrower jobs, Honeycomb suits high-cardinality debugging, and Langfuse suits LLM tracing you host yourself.
Find Out Why Your AI Agent Calls Fail
Infrastructure dashboards can report a healthy server while a caller hangs up. Most observability platforms track the servers underneath an agent, so Cekura covers the conversation on top of them, at each stage of the testing funnel.
Before launch, Cekura sends thousands of simulated callers at your agent and checks instruction-following, tool calls, and latency, plus red-team probes for jailbreaks and PII leaks.
At release, the test suite gates every deploy, so a prompt change that breaks a workflow gets caught before it ships. In production, Cekura scores live calls against the metrics you define, and flags drift, so failures can surface in a test run before customers report them.
Repeat testing matters because one passing call proves little. On Cekura’s benchmarks page, 8 voice agent platforms ran through 82 scenarios, and a scenario passed only if all three retained test calls passed. Retell came out most reliable at 75.6%, and ElevenLabs had the fastest reply at 1.27 seconds.
You connect your agent through a native integration, and live calls are scored against the metrics you define. If your team runs voice or chat agents in production, book a demo and see how it works alongside your current observability platforms.
Frequently Asked Questions
What are the best observability platforms?
The best observability platforms in 2026 include Cekura for voice and chat AI agents, Datadog for one-vendor SaaS, Dynatrace for enterprise root-cause analysis, Grafana for dashboards, and Prometheus for open-source metrics.
The right choice depends on your stack and which pricing meter matches your volume.
What are the pillars of observability?
The three pillars are logs, metrics, and traces. This guide also counts events, such as a deploy or an alert firing, as a fourth signal. Used together, they show why a request failed and what changed just before it.
What is the difference between observability and monitoring?
Monitoring alerts on thresholds you set ahead of time, while observability gives you the data to find unexpected failures.
Is Datadog an observability platform?
Yes. It spans infrastructure monitoring and APM, plus log management and alerting, and its Pro plan includes 1,000+ integrations.
Is Grafana an observability platform?
Partly. Grafana is a visualization and alerting layer that reads from many data sources, and Grafana Cloud adds a hosted back end for each signal. Self-hosting needs a store behind Grafana, such as Prometheus or Loki.
What is the best open-source observability platform?
The best open-source observability platform depends on the signal you need. Prometheus handles metrics and Grafana handles dashboards, OpenObserve stores logs, metrics, and traces in one engine, and Langfuse covers LLM applications.
How much do observability platforms cost?
Observability platforms cost from $0 on free tiers and self-hosted editions to $2,499 per month on Langfuse Enterprise, depending on what the vendor charges for.
Starting points include $15 per host (Datadog Pro, Splunk Infrastructure), $0.40 per GB (New Relic), $0.30 per GB (Middleware), and $150 per month (Honeycomb Pro). Prometheus and self-hosted OpenObserve are free.