
Langfuse does tracing well. Where teams hit the wall is production: no built-in evals, limited prompt management, or sparse alerting once your agent is live. Then something quietly goes wrong. I tested the tools people actually switch to, and this is what I found.
10 Best Langfuse Alternatives: At a Glance
Here's how they compare on the factors that matter most when choosing an LLM observability tool:
| 💻 Tool | 🎯 Best For | 💰 Starting Price | ⚡ Key Strength |
|---|---|---|---|
| Cekura | AI voice & conversational agent teams | Free trial, $30/mo paid | Testing & validation beyond observability |
| LangSmith | Teams on LangChain | Free, $39/seat/mo paid | Native LangChain tracing |
| Arize Phoenix | Vendor-lock-in avoiders | Free, open-source | Full self-hosting, no limits |
| Helicone | Fast observability setup | Free, $79/mo paid | One-line integration |
| Braintrust | Eval-heavy teams | Free, $249/mo paid | Experiment depth |
| Galileo | Production guardrails | Free, $100/mo paid | Eval-to-guardrail pipeline |
| Lunary | Full-stack on a budget | Free, $20/user/mo paid | All-in-one coverage |
| ZenML | ML pipeline teams | Free, open-source | End-to-end lineage tracking |
| Portkey | Multi-provider setups | Free, $49/mo paid | 1,600+ LLM routing |
| PromptLayer | Non-technical prompt owners | Free, $49/mo paid | Prompts out of code |
*Pricing correct as of March 2026. Verify with each vendor.
Why Look for Langfuse Alternatives?
Langfuse is a clean starting point. Tracing works and setup are quick. For early instrumentation, it does the job.
The problems show up when you try to move forward:
- No built-in evals: No structured way to run automated evaluations against your own datasets. Building a proper eval pipeline means assembling external tools yourself.
- Prompt management that stops at versioning: No playground, no A/B testing, and no way for non-engineers to iterate without opening the codebase.
- Weak production monitoring: No native alerts for output drift, latency spikes, or quality drops. You usually hear about a problem from a user before the platform catches it.
- Scalability issues with large datasets: As usage grows, the UI slows noticeably. Fine at low volumes, but a real bottleneck for teams running frequent eval cycles.
- Not built beyond its core use case: Langfuse is a development tool that teams often stretch into a production platform. Once you need guardrails, multi-provider routing, or deeper agent monitoring, you end up bolting tools onto it rather than getting that coverage from one place.
- Missing red teaming check: For teams running voice or conversational agents, there's a separate gap entirely. Observability tools track what the LLM did, but don't simulate whether the full multi-turn red teaming flow holds up under real conditions. That's the layer Cekura covers.
Which Langfuse Alternative Should You Choose?
The right tool depends on where your team is in the build cycle, how much infrastructure you want to own, and whether evals or monitoring matter more right now.
Choose:
- Cekura if you are deploying AI voice or conversational agents and need validation beyond what trace logs provide: pre-deployment simulation, automated regression testing, and production monitoring, not just trace visibility.
- LangSmith if you are already running LangChain and want tracing that works out of the box.
- Arize Phoenix if full self-hosting and zero vendor dependency are non-negotiable.
- Helicone if cost visibility and multi-provider observability need to be live fast.
- Braintrust if prompt experimentation is your main bottleneck and you run heavy eval cycles.
- Galileo if you are shipping agents at scale and want bad outputs blocked before users see them.
- Lunary if you want tracing, prompts, and evals under one roof without enterprise pricing.
- ZenML is for your team if it manages full ML pipelines and wants observability inside the orchestration layer.
- Portkey if you route across multiple LLM providers and want reliability controls and spend tracking in one place.
- PromptLayer if non-technical stakeholders own prompt iteration and deployments slow them down.
Skip these options if you only need basic request logging. Most of the tools here are built for teams well past that.
The 10 Best Langfuse Alternatives for LLM Observability
1. Cekura
Cekura is the testing and monitoring layer that every Langfuse alternative is missing.
Most tools on this list tell you what your LLM did. Cekura tells you whether it did it right. It runs on top of whichever observability stack you already use and catches the failures that traces and dashboards will never surface.
Key Features
- Scenario Simulation: Runs thousands of test conversations before go-live, including edge cases, accents, and interruptions.
- Custom Evaluation: Scores every run across 25+ metrics, including accuracy, missed intents, latency, and tool call correctness.
- Production Call Replay: Converts failed real calls into regression tests so the same failure cannot happen twice.
- CI/CD Integration: Runs your full test suite automatically on every prompt update, model swap, or config change.
- Observability and Alerts: Real-time production monitoring with Slack alerts for latency spikes and quality drops.
- A/B Testing: Compares agent versions across LLM, STT, and TTS providers against the same scenario set.
- Red Teaming: Multi-turn adversarial testing that simulates jailbreak attempts, system prompt extraction probes, and policy violations, surfacing security gaps before production.
Pros
✅ Catches silent failures that trace logs will never surface.
✅ Runs on top of any stack, no rebuild, no migration.
✅ Every failed production call becomes a regression test automatically.
Cons
❌ Purpose-built for conversational and voice AI, not general-purpose LLM pipelines.
❌ Developer plan caps at 10 concurrent calls. High-volume teams will need Enterprise.
Best For
- Teams deploying AI voice or conversational agents who need validation beyond what observability tools provide.
- Engineering teams running CI/CD pipelines that want automated agent QA on every deployment.
Pricing
The Developer plan starts at $30/month with a 7-day free trial, no credit card required. Enterprise pricing is custom. Plus, Cekura integrates natively with Retell, VAPI, ElevenLabs, LiveKit, Pipecat, and Bland.
2. LangSmith
LangSmith is the go-to for teams already building inside the LangChain and LangGraph ecosystem.
I tested LangSmith on a multi-step agent with chained LLM calls. Trace visibility was immediate. Every step, every call, every output in one place. For a LangChain shop, that means less time hunting for where a chain broke and more time fixing it.
The gaps showed up at scale. Larger experiment histories slowed the UI, and teams outside LangChain will hit configuration walls fast.
Key Features
- Tracing: See exactly what happened at every step of a run, down to individual LLM calls.
- Evals: Run automated tests against your own datasets and collect human feedback in the same place.
- Prompt Hub / Playground / Canvas: Manage and refine prompts without switching tools.
- 1-Click Deployment: Ship LangGraph agents to production with memory and scheduling included.
- Agent Builder: Non-technical teammates can build and run agents without writing code.
Pros
✅ End-to-end trace visibility makes debugging straightforward.
✅ Automated evals with datasets cut iteration time.
✅ Native LangChain/LangGraph and OpenTelemetry integration.
Cons
❌ UI slows down with large datasets or heavy experiment history.
❌ Hard to integrate if you are not running LangChain.
Best For
- Teams already running LangChain or LangGraph who want tracing without extra configuration.
- Engineering teams that need end-to-end visibility across multi-step agent flows.
Pricing
LangSmith has a free Developer plan with 5,000 traces/month. Paid plans start at $39/seat/month. Enterprise pricing is custom. Traces are billed separately at $2.50-$5/1k depending on retention.
3. Arize Phoenix
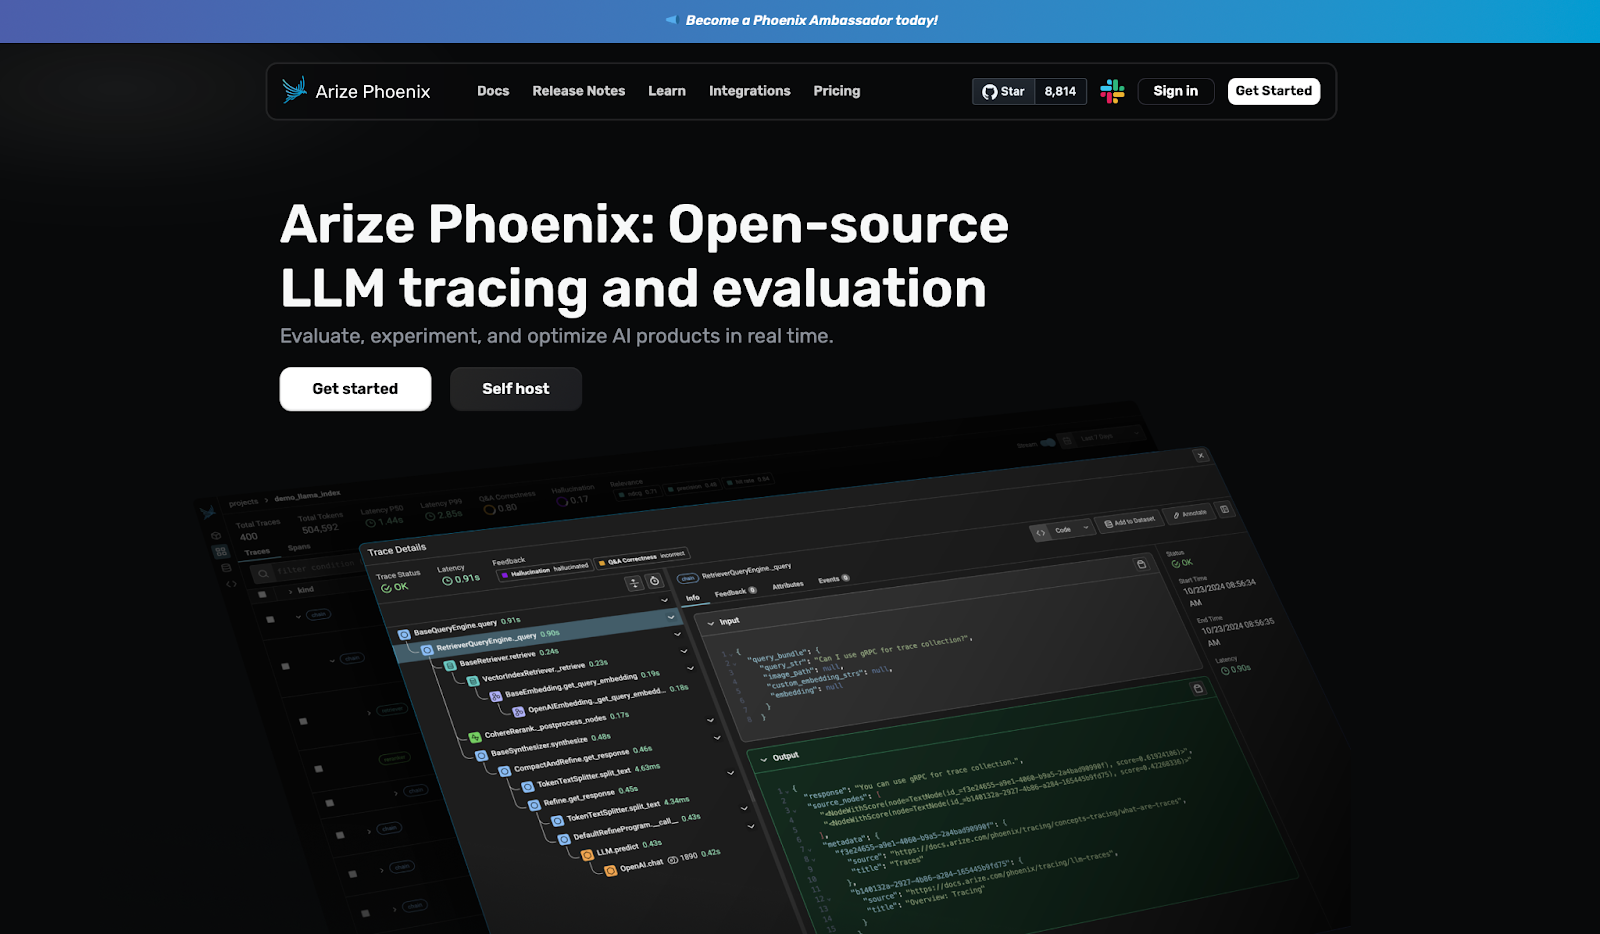
Arize Phoenix is for AI engineers who need full visibility and want to own their infrastructure.
I tested Arize Phoenix on a retrieval pipeline with embedding visualization enabled. Embeddings are how your model groups similar content, and the clustering view made it easy to spot exactly where retrieval was falling apart. For a free tool, that level of diagnostic depth is hard to match.
But it can't take you much further than that. Prompt management is missing, usage analytics are thin, and self-hosting takes more time than most teams budget for.
Key Features
- Application Tracing: Collects data across any language or library without rewriting your setup.
- Prompt Playground: Iterate on prompts, compare outputs, and pin down what is actually failing.
- Evals and Annotations: Prebuilt eval templates with human feedback built in.
- Embedding Visualization: See how your model groups similar content and find where retrieval goes wrong.
- Full Self-Hosting: Runs on your own infrastructure with no usage caps.
Pros
✅ Fully open-source and self-hostable with no usage limits.
✅ Embedding clustering makes retrieval issues faster to find.
✅ No vendor dependency means you are not locked into anyone's pricing or roadmap.
Cons
❌ UI has a learning curve that slows down anyone new to the tool.
❌ No prompt management or usage analytics once you move to production.
Best For
- AI engineers and data scientists who need full diagnostic visibility into retrieval pipelines.
- Teams that require complete self-hosting with no vendor dependency or usage caps.
Pricing
Arize Phoenix is free and open-source for self-hosted deployments with no limits on traces or retention.
Managed plans start free at 25k spans (individual units of data Phoenix tracks per request) per month and go up to $50/month for Pro. Enterprise pricing is custom.
4. Helicone
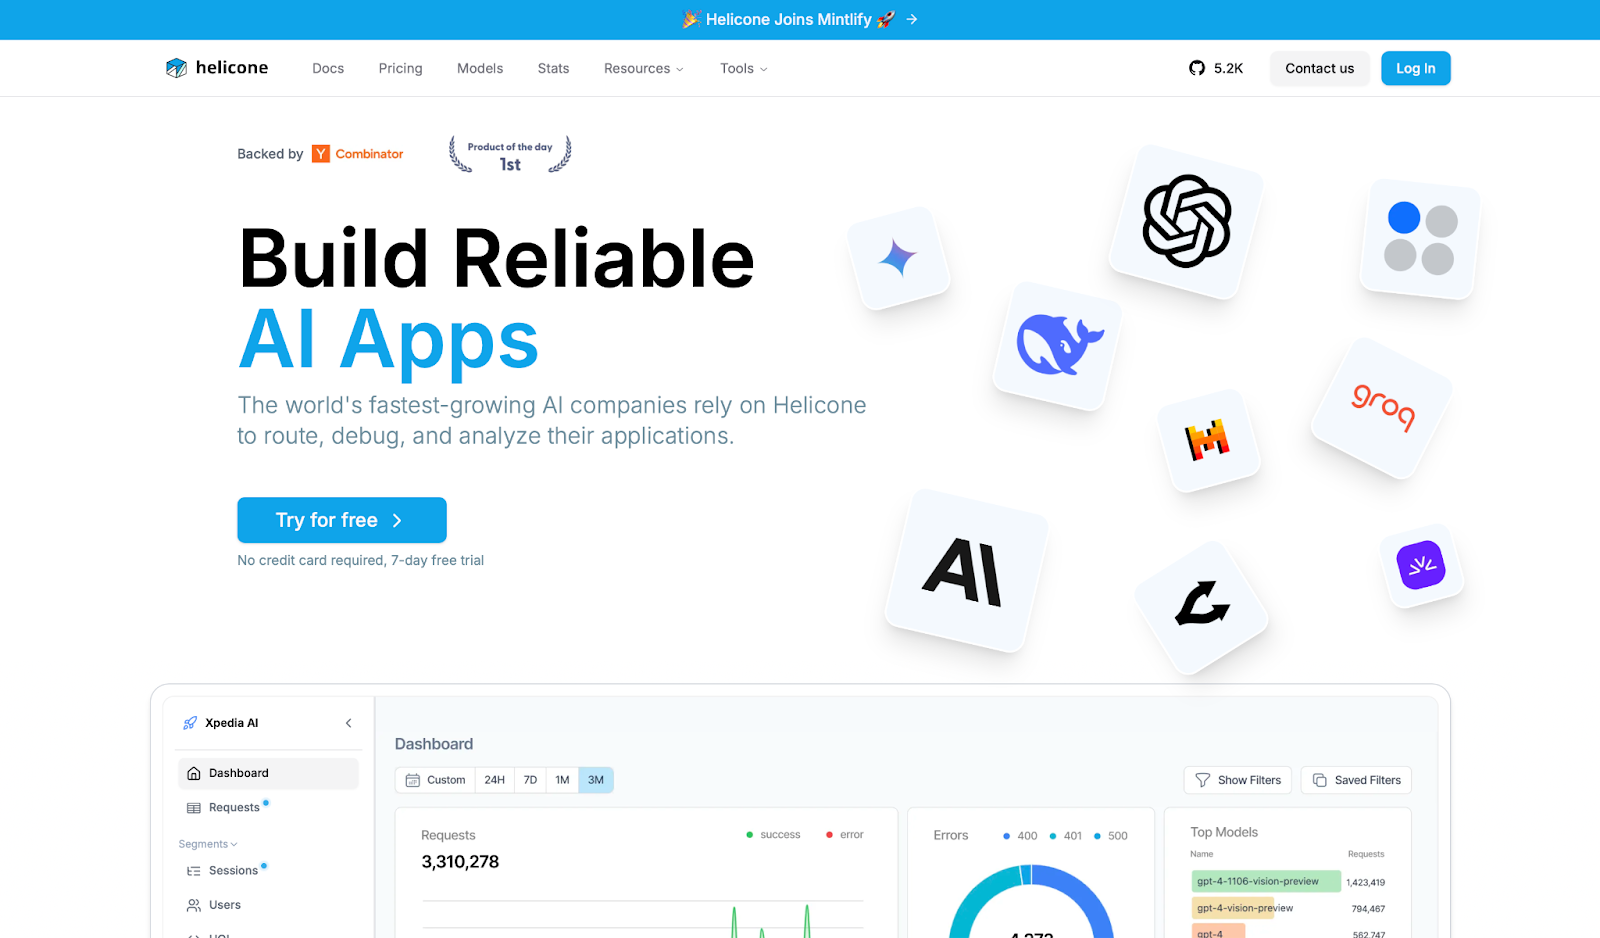
Helicone is the fastest path to multi-provider observability without a complex setup.
I tested Helicone on a multi-provider setup with OpenAI and Anthropic running in parallel. One line of code and requests were flowing through the dashboard, with cost breakdowns, latency, and alerts live almost immediately. This was the fastest setup I ran across in this roundup.
The tradeoff is structural. Every bit of observability runs through Helicone's proxy, a middleman between your app and the model, which means if their infrastructure goes down, your app goes with it.
Key Features
- LLM Observability: Monitor requests, latency, cost, and user behavior across every call.
- AI Gateway: Caching, rate limiting, and automatic fallbacks — if one provider goes down, traffic switches to another.
- Prompts and Testing: Version prompts, run playground tests, and score outputs against datasets.
- Data Management: Custom properties and retention from 7 days on free to unlimited on Enterprise.
- 1-Line SDK: Self-hostable, works across OpenAI, Anthropic, and other major providers.
Pros
✅ One-line integration gets you live faster than most tools in this category.
✅ Cost breakdowns and alerts show you where your LLM budget is actually going.
✅ Caching and fallbacks built into the gateway, no extra infrastructure needed.
Cons
❌ All observability runs through a proxy, so Helicone downtime becomes your downtime.
❌ Seven days of retention on the free plan makes debugging anything older than a week impossible.
Best For
- Developer teams running OpenAI or Anthropic who need observability live in minutes.
- Teams that need cost visibility and multi-provider routing without a complex setup.
Pricing
Helicone is free up to 10k requests/month with 7-day retention. The Pro plan starts at $79/month with unlimited seats and 30-day retention. The team plan starts at $799/month and includes SOC-2 & HIPAA compliance. Enterprise pricing is custom.
5. Braintrust
Braintrust is built for teams that run large experiment volumes and need structured prompt quality tracking.
I tested Braintrust on a prompt iteration workflow with versioned datasets. The experiment comparison view is genuinely well built. You can run hundreds of variations and see exactly what shifted between runs, which matters more than it sounds when you are three weeks into a prompt engineering cycle.
It's one of the few tools that makes that kind of iteration feel manageable rather than chaotic, but it's not built for watching what your model does in production minute by minute.
Key Features
- Observability: See every prompt, response, and tool call as it happens, with latency and cost attached.
- Evals: Score experiments against saved test sets to catch breaking changes before they ship.
- Loop Agent: Generates prompts, scoring criteria, and test cases automatically to reduce manual eval work.
- Brainstore DB: A purpose-built database for querying large volumes of traces fast.
- Custom Views: Build review workflows and send traces into test sets in one click.
Pros
✅ Eval-first design makes prompt experimentation structured and repeatable.
✅ Loop Agent reduces the manual work of building and maintaining eval pipelines.
✅ Works across Python, TypeScript, Go, and others without locking you into a specific stack.
Cons
❌ Live production monitoring is weaker than tools built specifically for that job.
❌ Usage-based pricing with tiers that are consistently hard to forecast.
Best For
- Engineering teams running high volumes of prompt experiments that need structured tracking.
- Teams that want to catch breaking changes in prompt quality before they ship.
Pricing
Braintrust is free up to 1M spans with 14-day retention. The Pro plan starts at $249/month with unlimited spans and 30-day retention. Enterprise pricing is custom.
6. Galileo
Galileo is for enterprise teams that need to catch agent failures before users do, not after.
I tested Galileo on an agent workflow with real traffic monitoring enabled. The eval-to-guardrail pipeline is the real differentiator here. You build your tests offline, and Galileo converts them into lightweight models that screen every request in under 200ms.
That pipeline makes sense if you are shipping at scale and cannot afford to find out something broke from a user complaint. But if your team is still experimenting or runs models outside Galileo's supported list, the learning curve will hit before any of that value does.
Key Features
- Groundtruth Capture: Build living test datasets from real production data and domain expert annotations.
- Accurate Evals: Score your outputs against prebuilt templates for retrieval pipelines (RAG), agents, and safety.
- Eval-to-Guardrails: Turn your tests into live filters that block bad outputs before they reach users.
- Insights Engine: Analyzes agent behavior patterns and prescribes specific fixes rather than just flagging problems.
- Flexible Deployment: Runs on SaaS, private cloud, or on-premise.
Pros
✅ Eval-to-guardrail pipeline catches problems before they reach users, not after.
✅ Insights engine tells you specifically what to fix and where it went wrong.
✅ Deploys on SaaS, private cloud, or on-premise for teams that cannot send data outside their walls.
Cons
❌ Limited compatibility with pre-trained models outside its supported list.
❌ Learning curve is steep, and documentation doesn't always keep up.
Best For
- Enterprise teams shipping LLM agents at scale who need failures blocked before users see them.
- Teams that want to convert offline test results into live production guardrails.
Pricing
Galileo is free up to 5k traces/month with unlimited users and evals. The Pro plan starts at $100/month for 50k traces (when billed yearly). Enterprise pricing is custom.
7. Lunary
Lunary is for teams that need full LLM observability without enterprise-level costs.
I tested Lunary on a multi-provider setup and had traces flowing within minutes. The interface is clean, and getting logs, prompts, and evals under one roof is genuinely convenient when you are tired of jumping between tools.
The gaps show up on the free plan, where 10k events per month runs out fast in any real workload, and the features that matter most sit behind the paid tier.
Key Features
- Observability: Log traces and errors with instant search across your model's activity.
- Analytics: Track model costs, user satisfaction, and topic patterns through custom dashboards.
- Prompt Management: Version prompts and run A/B tests with non-technical teammates in the loop.
- Evaluations: Score responses, collect human reviews, and track feedback over time.
- Security: PII masking (hides personal data from logs), multi-modal support, and self-hosting via Docker.
Pros
✅ Full-stack coverage across observability, prompts, evals, and analytics in one tool.
✅ PII masking keeps personal data out of your logs automatically.
✅ New features ship fast, and the changelog actually reflects what users ask for.
Cons
❌ Free plan caps at 10k events per month, which runs out quickly in real workloads.
❌ Self-hosting requires technical setup, and advanced features stay behind the paid tier.
Best For
- Teams building internal or customer-facing LLM apps who need full-stack coverage on a budget.
- Orgs that want tracing, prompts, and evals under one roof without enterprise pricing.
Pricing
Lunary is free up to 10k events/month with 30-day log retention. The Team plan starts at $20/user/month with 50k events and one year of history. Enterprise pricing is custom with self-hosting included.
8. ZenML
ZenML is for ML engineering teams that need to standardize pipelines across different infrastructure setups.
I tested ZenML on an LLM evaluation pipeline running locally, then moved to a cloud environment. The same pipeline code ran without changes across both. Getting there took longer than expected, and the documentation left gaps in the harder edge cases.
But the lineage tracking across data, models, and code is worth the ramp-up for teams who have been guessing which pipeline version produced which result.
Key Features
- Pipeline Orchestration: Define and run workflows locally, on Kubernetes, or on orchestrators like Airflow without rewriting code.
- Artifact and Model Registry: Full version history and lineage across datasets, models, and code.
- Stack Components: 60+ integrations covering LLM frameworks, experiment trackers, and deployers.
- Model Control Plane: Version approvals and audit trails accessible from the UI.
- Security: SOC2 and ISO27001 certified, with RBAC, SSO, and air-gapped deployment options.
Pros
✅ Framework-agnostic with 60+ integrations, so your team keeps the tools it already uses.
✅ End-to-end lineage across data, models, and code so you always know what ran and what it produced.
✅ Fully open-source and self-hostable with no usage limits on the free tier.
Cons
❌ Learning curve is steep beyond basic usage, and documentation gaps make troubleshooting slow.
❌ Performance issues surface when scaling pipelines, with ongoing bug reports on GitHub.
Best For
- Data and ML engineering teams managing full pipeline lifecycles across multiple environments.
- Teams that need end-to-end lineage tracking across data, models, and code.
Pricing
ZenML is fully open-source and free to self-host with no limits on runs or projects. Pro self-hosted plans are custom annual contracts. Startup and academic discounts available on request.
9. Portkey
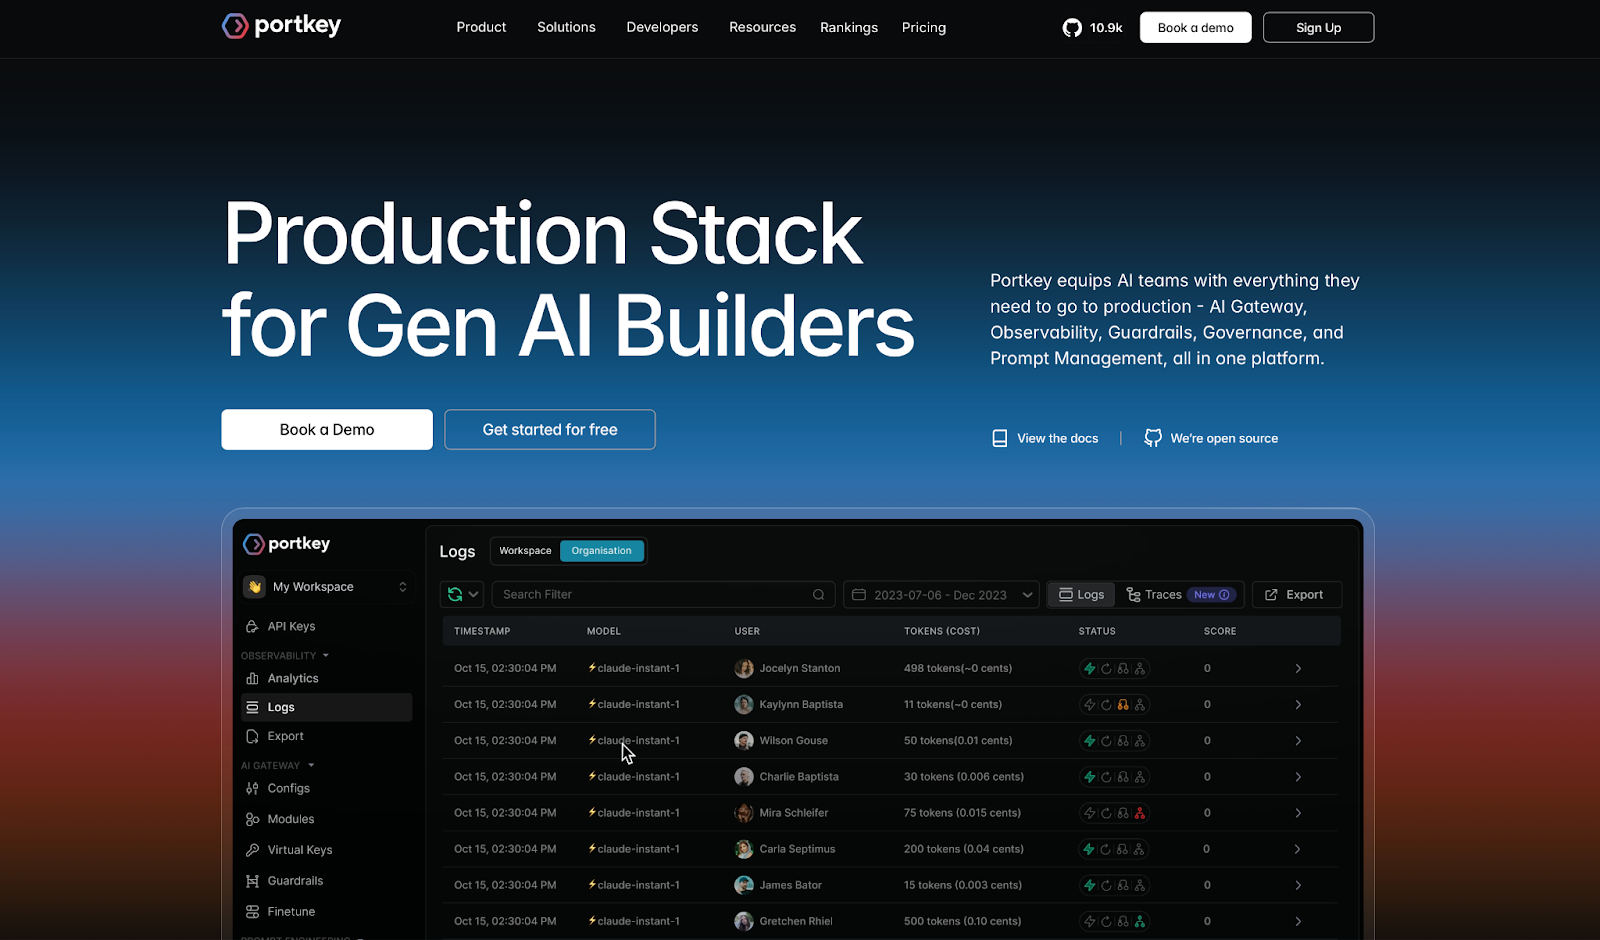
Portkey is for AI teams running multiple LLM providers who need reliability controls and cost visibility in one place.
I tested Portkey on a multi-provider setup with fallbacks and real-time cost tracking enabled. Three lines of code and requests were routing, logging, and failing over automatically. This was the fastest multi-provider setup I ran in this entire roundup.
The tradeoff is that the feature surface is wide, and new users will need time before the platform starts feeling intuitive.
Key Features
- AI Gateway: Routes requests across 1,600+ LLMs with automatic fallbacks, retries, and load balancing built in.
- Observability: Real-time dashboard with cost and latency data across every request, filterable by metadata.
- Guardrails: Input and output checks to catch harmful or off-policy responses before they reach users.
- Prompt Management: Version, test, and deploy prompts via API without touching application code.
- Governance: Role-based access controls (who can see and do what), budget limits, PII redaction (automatic removal of sensitive data like names and emails), and activity logs.
Pros
✅ Universal API connects 1,600+ LLMs without rewriting your integration for each one.
✅ Fallbacks and retries keep production running when a provider goes down.
✅ Real-time cost and latency dashboard makes spend visible from day one.
Cons
❌ Wide feature set takes time to navigate, especially for teams new to the platform.
❌ All requests route through a proxy, so Portkey downtime affects your app directly.
Best For
- AI teams routing across multiple LLM providers who need reliability controls in one place.
- Teams that want automatic fallbacks and retries without managing extra infrastructure.
Pricing
Portkey is free up to 10k logs/month with 3-day retention. The Production tier charges $49/month for 100k recorded logs, with overages at $9 per additional 100k requests and 30-day log retention (90-day for metrics). Enterprise pricing is custom, with private cloud and self-host options available.
10. PromptLayer
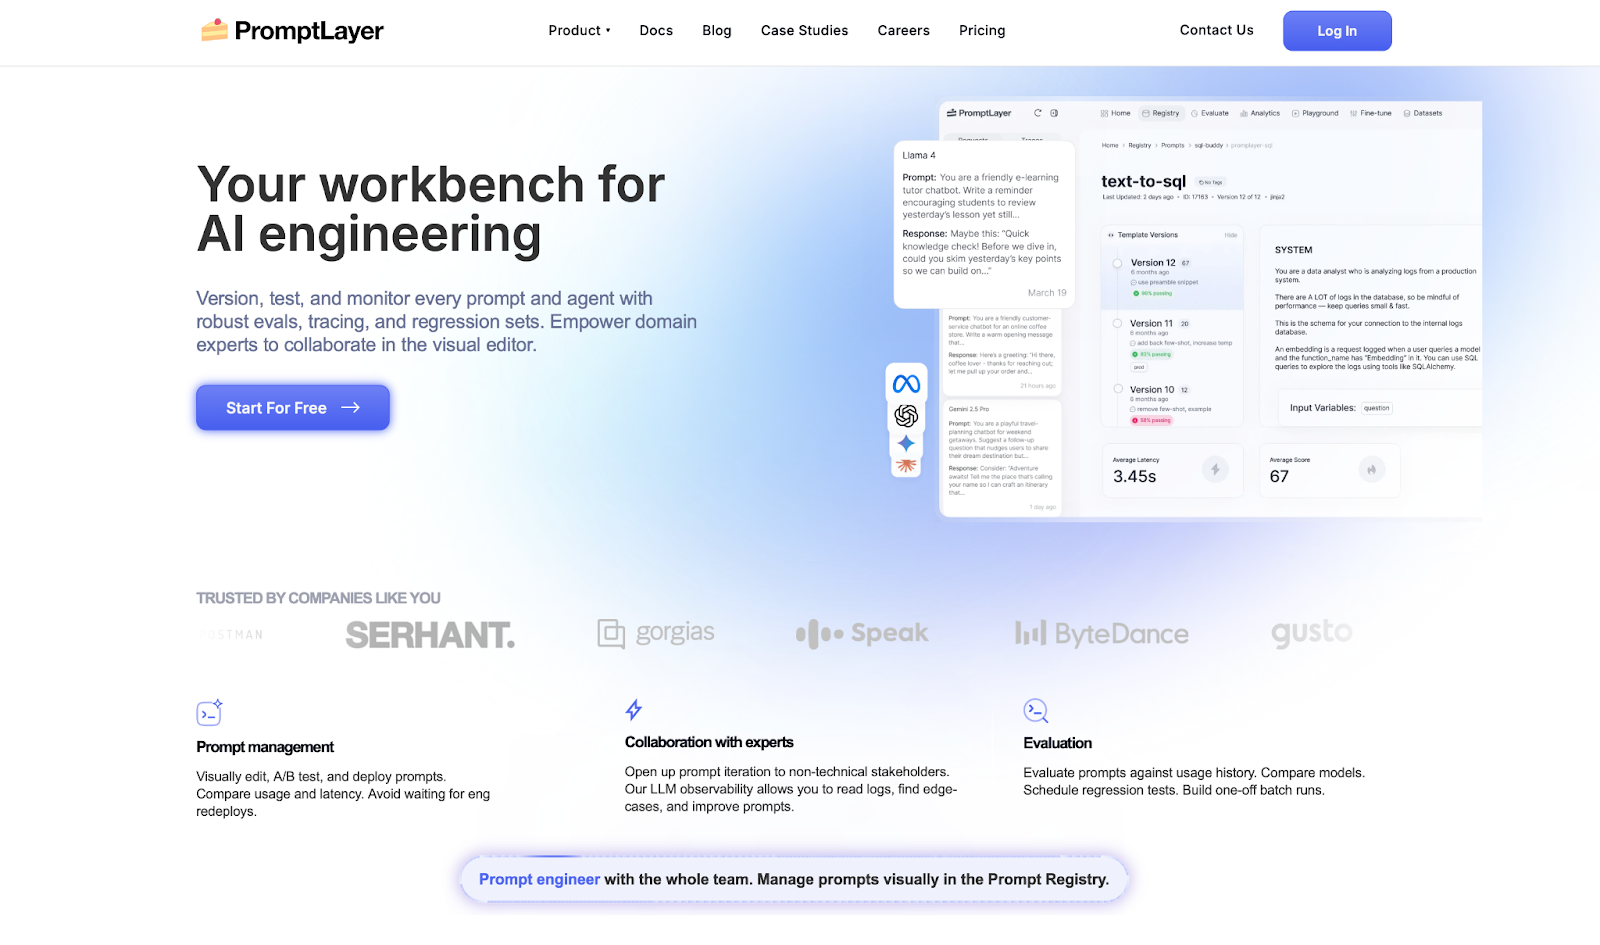
PromptLayer is for teams that need non-technical stakeholders involved in prompt iteration without waiting on deploys.
I tested PromptLayer on a prompt versioning workflow with a mixed team. The visual editor made it easy for a non-engineer to edit and test a prompt version without touching the codebase. That handoff is where PromptLayer earns its place.
The limits show up when you push it harder. Eval pipelines slow down on large test sets, and teams with light or occasional prompt workflows will find it more overhead than it is worth.
Key Features
- Prompt Management: Edit, version, and deploy prompts from a visual dashboard without engineering redeploys.
- Evals: Run regression tests, compare models, and schedule batch evaluations against usage history.
- LLM Observability: Log requests, track latency and cost, and surface edge cases in production.
- A/B Testing: Release new prompt versions gradually and compare performance metrics.
- Prompt CMS: Move prompts out of code so domain experts can iterate directly.
Pros
✅ Decouples prompts from deploys, so non-engineers can iterate without a ticket.
✅ Request logging with latency and cost tracking makes production debugging concrete.
✅ Eval suite covers regression testing and model comparison in one place.
Cons
❌ Eval pipelines slow down noticeably on large test sets.
❌ HIPAA, EU hosting, and single-tenant options are Enterprise-only.
Best For
- Product and engineering teams that need non-technical stakeholders to iterate on prompts directly.
- Teams where every prompt change currently requires an engineering deploy.
Pricing
PromptLayer offers a free plan available with 2,500 requests/month. The Pro plan starts at $49/month with pay-as-you-go at $0.003/transaction. The Team plan is $500/month for larger volumes. Enterprise pricing is custom.
How To Evaluate Langfuse Alternatives
Most LLM observability tools look similar on feature lists and pricing pages. The differences show up when your agent is live, a call breaks quietly, and you need to know exactly where it went wrong.
What matters is whether the tool gives you enough signal to act before a user finds the problem.
Here's what to look for:
- Tracing depth: Does it show what actually happened at every step, or just that a call was made?
- Eval coverage: Can you test against your own data, or are you stuck with generic templates?
- Prompt management: Can non-engineers iterate on prompts without touching the codebase?
- Production monitoring: Does it flag output drift on its own, or only after you go looking?
- Integration overhead: How much setup before your first useful trace?
How to Test Each Tool
Run each candidate through four stages:
- Onboarding: How fast can you get real traces flowing? Anything that takes more than a few minutes before a first result is a flag.
- Pipeline stress testing: Push each tool through multi-step agent flows with tool calls, retrieval, and branching logic to see where coverage breaks down.
- End-to-end validation: Run each pipeline through Cekura alongside the tool being tested, checking for silent failures and incorrect outputs that the observability layer missed.
- Failure auditing: When a run breaks, how quickly can you pinpoint why? That gap between failure and diagnosis is where most tools lose you.
From Observability to Autonomous Execution
Traces tell you a call happened. They don't confirm that the agent did the right thing.
Every tool on this list shows you what your LLM did. None of them simulate what happens when a real user pushes it off script, or validate that the task is actually completed on the other end.
That's what Cekura is for.
What Cekura Does That No Observability Tool Does
I run Cekura on top of whichever observability platform I am using. It's the only way to know whether the agent behaves correctly once it is live, not just whether the traces look right.
Here's what Cekura offers:
- Scenario Simulation at Scale: Auto-generates thousands of test cases from your agent description, including edge cases, accents, background noise, and interruptions, with 100% outcome verification before anything goes live.
- Metrics-Driven Evaluation: Scores every run across 25+ metrics, including instruction following, latency, tool call accuracy, hallucinations, and talk ratio. Green dashboards miss these. Cekura does not.
- Production Call Replay: Converts failed real calls into automated test cases. Every pain point becomes a regression test.
- Custom Personas: Simulates impatient users, heavy accents, and noisy environments to surface the failures that only appear under real conditions.
- CI/CD Integration: Runs your full test suite automatically on every prompt update, model swap, or configuration change before it ships.
- A/B testing across platforms and models: Compare multiple versions of your agent against the same scenarios, whether you're testing different platforms or model providers (LLM, STT, TTS), and review the results in one place.
- Observability and Alerts: Real-time monitoring with Slack alerts for latency spikes and quality drops, so you find out before your users do.
Plus, it offers native integrations with Retell, VAPI, ElevenLabs, LiveKit, and Pipecat, extendible to Langfuse traces via API. You don't rebuild anything. You add an execution and validation layer on top of what you already have.
Ready to see what your agent does when no one is watching? Schedule a demo with Cekura.
Frequently Asked Questions
What Is the Best Langfuse Alternative in 2026?
The best Langfuse alternative depends on what you need. LangSmith works best for teams already running LangChain. Arize Phoenix is the right call for full self-hosting. Helicone wins on setup speed.
Pair any of them with Cekura to validate agent outputs before they reach real users.
Why Do Teams Switch From Langfuse?
Teams switch from Langfuse when they outgrow its eval capabilities or need stronger production monitoring. Some hit limits with large datasets. Others move when they need automated guardrails or alerting that trace logs cannot provide.
What Is the Difference Between LLM Observability and LLM Evaluation?
LLM observability tracks what your model does in real time, capturing traces, latency, and errors. LLM evaluation scores whether those outputs were right. Observability tells you when something broke. Evaluation tells you if it was working in the first place.
Do I Need Developers to Use These Tools?
It depends on which one you choose. Helicone and PromptLayer work for non-technical users with minimal setup. LangSmith, Braintrust, and Arize Phoenix need a developer to configure and maintain. ZenML assumes a technical lead from day one.