
An AI monitoring observability checklist is the set of signals you capture before an agent reaches production, plus the thresholds that tell you when something has broken. A good one covers traces, tool calls, timing, quality scores, and artifact versions, and it says whether failed sessions still count toward your reported numbers.
Most published guidance on this subject stops at the first half of that sentence. It lists telemetry categories, tells you to log tool arguments, and ends. The harder question is which specific fields you need to reconstruct a failure. A second is what you do with sessions that fell over before they produced any output.
This checklist answers both. Every item states what to capture, why it matters, and what it costs you to collect.
What an AI monitoring observability checklist has to cover
Agent systems fail differently from services. A web service either returns a response or it does not. An agent can return a fluent, well formed response that is wrong, or perform an action that does not match what it just told the user. Either way, it looks like success to a status code.
That gap is the reason observability for agents has to be modelled on the agent's internal structure rather than on request and response. A 2024 systematic mapping study from Data61 at CSIRO, which surveyed 17 tools in this space, proposes a taxonomy of what to trace across an agent's whole lifecycle.
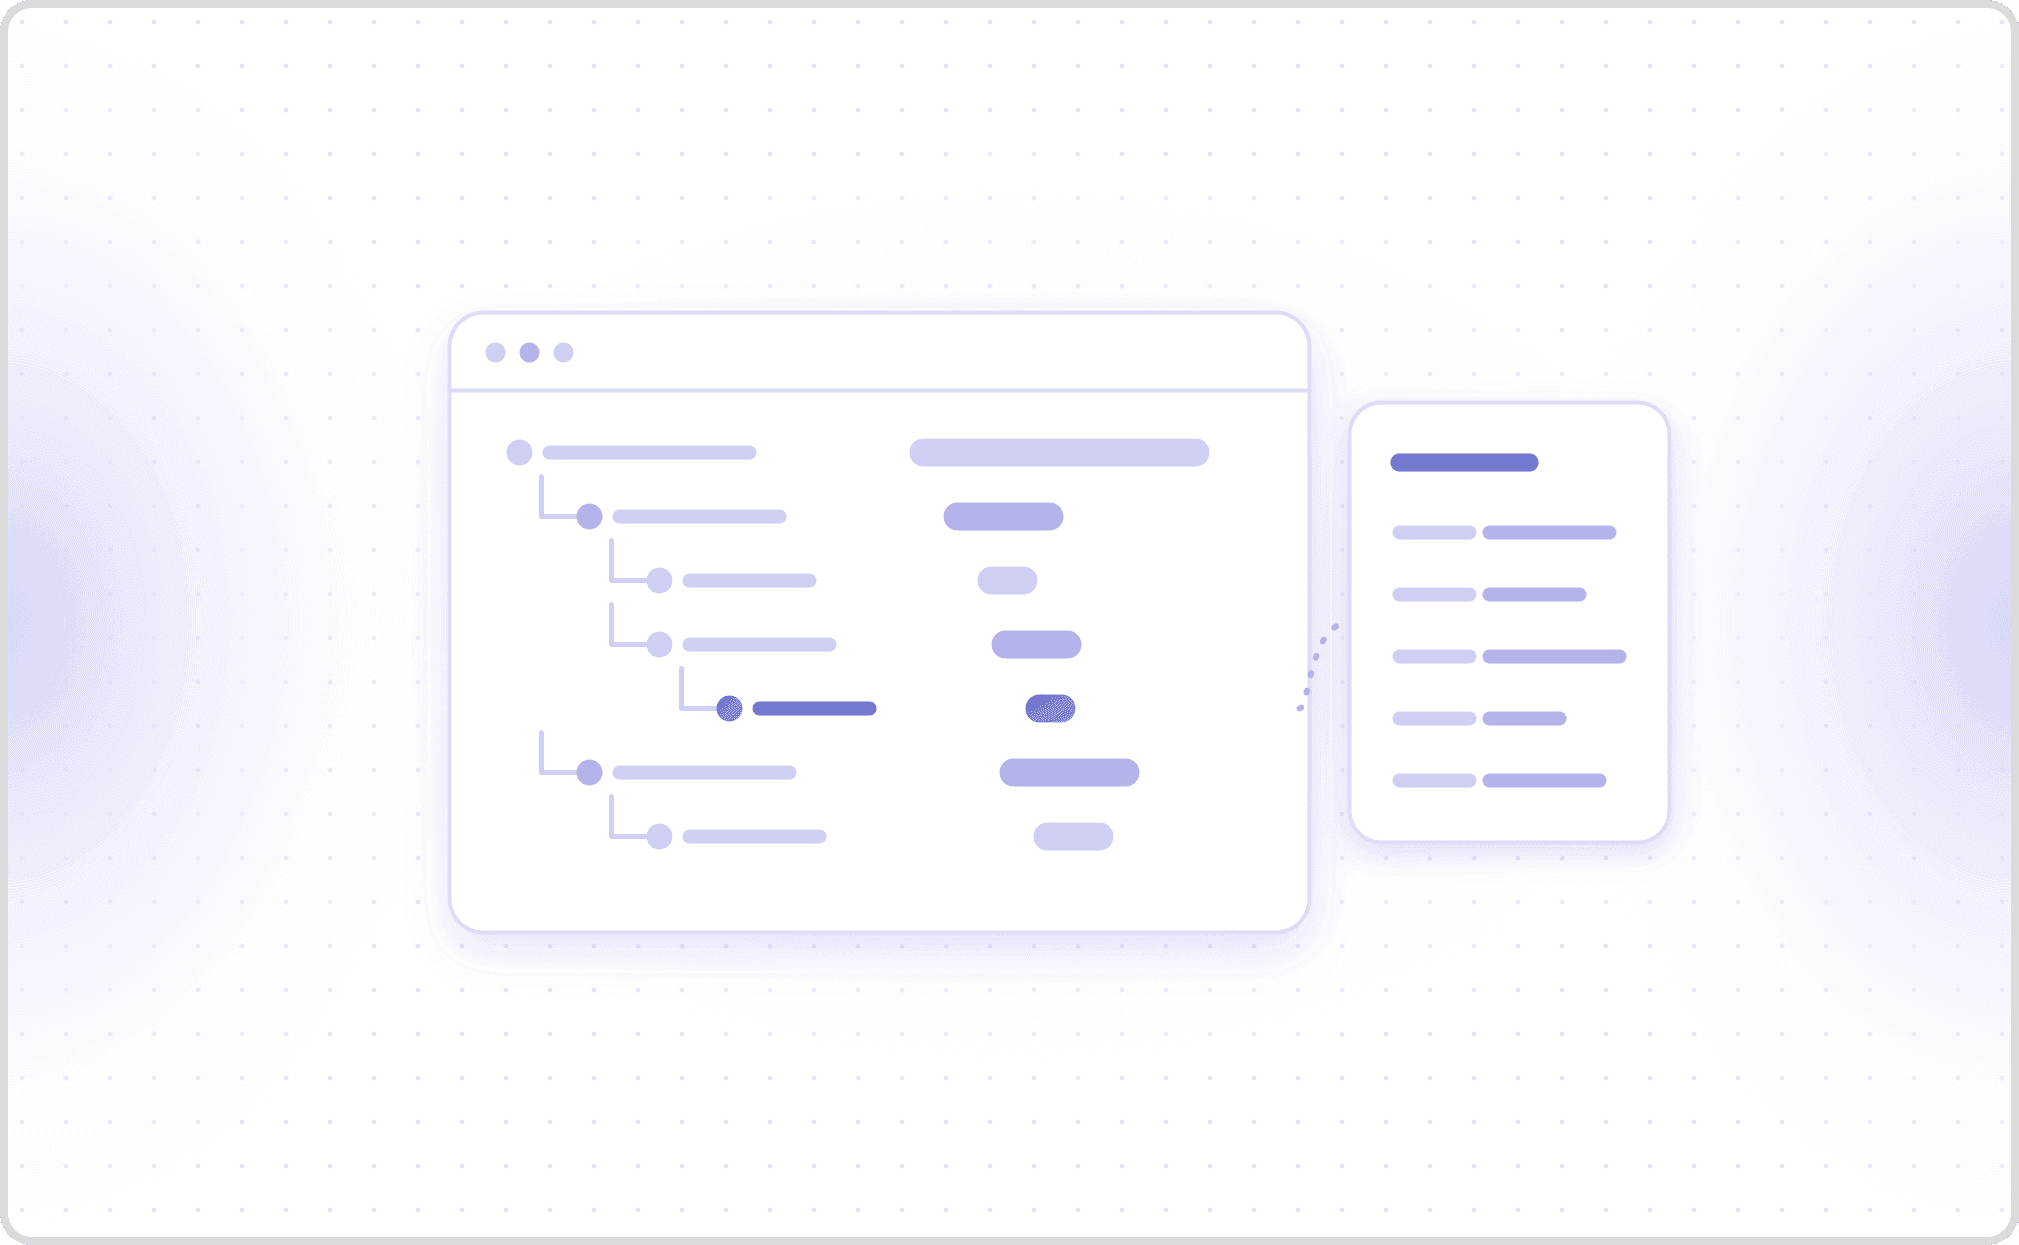
Its stated aim is to let stakeholders "proactively understand the agents, detect anomalies, and prevent potential failures". The paper offers that taxonomy as a reference template for building the infrastructure, not as a description of any one tool. The taxonomy of AgentOps breaks an agent trace into nested spans, one per artifact, and treats the span as the unit of record.
Its nine span types map onto what a production checklist has to cover:
| Span type | Metadata the paper assigns it | What you lose without it |
|---|---|---|
| Agent | Agent role, agent persona | No way to group a session's work or explain its behaviour |
| Reasoning | Context, retrieved knowledge, inference rules and boundary, outcome | Cannot tell a bad conclusion from bad inputs |
| Plan | Goal, constraints, context, historical plans | Cannot tell a bad plan from bad execution |
| Workflow | Tasks, task dependencies, operational context, past execution history | Cannot locate which step broke |
| Task | Task description, task status | Cannot tell which step is still open |
| LLM | LLM name, version, parameters | No cost attribution, no regression evidence |
| Tool | Tool name, version, configuration settings | Cannot prove the action matched the intent |
| Evaluation | Test cases, testing metrics, testing results | No record of what was scored, or against what |
| Guardrail | Guardrail target, guardrail action | No audit trail for a safety decision |
Every span carries the same operation metadata regardless of type. That is name, start timestamp, duration, parent ID, events, links, inputs and outputs, error type and traceback, and token count metrics.
One scope note before the list. These eleven checks cover the telemetry layer: what the agent did, how long it took, what it sent to which tool, and what that cost. They do not cover security event capture, which regulated deployments need on top of it.
If you are logging to satisfy HIPAA or the EU AI Act, or to pass a SOC 2 audit, you need a separate class of signal. Common practice is to log these as discrete events.
That list usually includes prompt injection attempts, policy violations, exposure of personal or health information, and privilege escalation by an agent acting for a user. Treat those as a parallel list rather than as items to fold into this one. Their retention is set by the regulation or the audit scope, not by your storage budget.
Work through the eleven checks below in order. The first five are instrumentation, and nothing later works without them. The rollout section at the end sequences the same eleven for implementation. That is a different order, because the checks you read first are not the ones you build first.
Checks 1 to 3: instrument the trace, not the transcript
Check 1. Record a root span per session, with a stable identifier. Every downstream question starts with "show me that conversation". If a session cannot be reassembled from its identifier, you are reading logs, not tracing.
The cost here is real. A high traffic agent generates many spans, and sampling that drops whole sessions rather than whole traces hides the rare failures you built this for.
Check 2. Capture inputs and outputs at every span, not only at the boundary. The Data61 taxonomy lists inputs and outputs as attributes on every span, not only the root. That matters because the final answer does not reveal where a multi step process diverged. Recording intermediate values is what separates a trace you can debug from a trace you can only count.
The cost is the storage bill checks 1 and 3 share. Full fidelity at every span is the most expensive line item here, which is why the rollout section scopes it to tool spans first.
Check 3. Record error type, message, and traceback on every span that can fail. An agent that swallows a tool exception and improvises around it looks healthy at the boundary. Store the traceback, not just a boolean.
The cost is close to nothing, which is why this one is most often skipped rather than deferred. A traceback is a few hundred bytes against the kilobytes check 2 already stores.
The uncomfortable part of checks 1 to 3 is storage. Full input and output capture on every span is expensive at volume, and teams that discover this late respond by turning capture off. Decide the retention policy before you instrument, not after the first invoice. A common split is full capture on a sampled percentage of sessions, plus full capture on every session that triggered an error or a low quality score.
Checks 4 to 5: name your telemetry with a shared convention
Check 4. Adopt a published naming convention rather than inventing attribute names. OpenTelemetry maintains semantic conventions for generative AI systems that define the span and metric names for this exact problem.
The GenAI agent span conventions specify gen_ai.operation.name, with well known values including invoke_agent, execute_tool, plan, and retrieval. Alongside it sit gen_ai.agent.id, gen_ai.agent.name, and gen_ai.agent.version. The client metric gen_ai.client.token.usage carries gen_ai.provider.name, gen_ai.request.model, gen_ai.response.model, and gen_ai.token.type.
One caveat that vendor content on this topic tends to omit: the gen_ai.* attributes are marked Development, not Stable, in the conventions themselves. Adopting them still beats inventing your own names, because the migration path is documented and your instrumentation stays portable.
The cost of check 4 is dashboard churn. Names will move while the conventions sit at Development, so budget a migration pass rather than treating the mapping as settled.
Check 5. Record model name and version on every model call, separately for request and response. The convention splits gen_ai.request.model from gen_ai.response.model for a reason. Providers route requests to point releases, so the model you asked for and the model that answered are not reliably the same. A silent version change is one of the few root causes that explains a quality drop with no code deploy behind it.
The cost is discipline rather than engineering. Every call site has to log both fields, and one path that records only the model you requested quietly reopens the blind spot.
The payoff for check 4 arrives here. Because the token usage metric carries provider, model, and token type as attributes, spend becomes attributable to a session and a route rather than to an API key. That matters more for agents than for single call applications, because the expensive failure mode is silent.
An agent that retries a failing tool, or loops between two reasoning steps, produces no error and no user complaint while burning tokens at several times the expected rate. A loop raises no exception, so an error rate will never catch it. Alert on gen_ai.invoke_agent.inference_calls and gen_ai.invoke_agent.tool_calls, the per-invocation counts the same conventions define, with tokens per completed session as the backstop.
Checks 6 to 7: verify tool calls against the conversation
Most observability guidance tells you to capture tool arguments. Far less of it tells you to assert on them. Vendor evaluator suites do ship tool-parameter checks, but a checklist that stops at capture leaves the assertion to you. The assertion is what catches a failure class that transcript level monitoring cannot see.
Check 6. Compare the arguments sent to a tool against what the user actually said. An agent can transcribe a value correctly, repeat it back correctly, and still pass a different value to the function that acts on it. Output level monitoring scores that conversation as a success, because the conversation was fine. The action was not.
In practice the assertion is narrow. Extract the value the user supplied from the transcript turn, and the value the agent passed in the tool arguments. Fail the session when they differ, whatever the tool returned. That comparison is only possible if both sides were stored, which is why check 2 sits where it does.
The cost is an extraction rule per tool. Someone has to write the rule that pulls the user's value out of the turn. A rule that is too loose passes wrong arguments, and one that is too strict fails correct ones.
This is not hypothetical. A frozen matched study of seven voice agent configurations, 82 scenarios, and three retained repeats gave every provider the same system prompt, tool definitions, and test data. It surfaced this exact defect class more than once.
Cekura's published benchmark records a call where the transcript captured a phone number correctly but a different number was sent to the tool. Another shows consent collected while the consent identifier was omitted from the handoff tool. A third shows an agent narrating a tool call and continuing with an invented result.
Each of those passes a transcript review. Each requires span level tool argument capture to detect at all.
Check 7. Alert on tool calls that succeed with incomplete payloads. A dropped optional field is not an error, so it raises no exception and appears in no error rate. When the dropped field is a consent identifier or a routing identifier, the business consequence arrives days later through a different channel. Assert on the presence of required fields at the span level, and treat a missing one as a failure even when the tool returned 200.
The cost is upkeep. Someone has to maintain the required-field list for each tool. A stale list either misses a field that became required, or pages the team about one that was always optional.
Checks 8 to 9: count what failed, and time what ran
Check 8. Keep failed sessions in the results, and print the population beside every score. Calls that never connect, sessions that time out before the first token, and runs that produce no transcript are the easiest things to drop from a dashboard. They have no content to score. Dropping them from your reliability figures inflates every one of them.
Dropping them from a quality metric they cannot be scored on is defensible, provided the population that metric covers is printed next to it. Cekura's benchmark works this way. Task completion reaches 97.56% over the 205 calls that had outcome evidence, while infrastructure reliability is 82.93% across all 246 retained calls, 41 of which never connected.
Both numbers are accurate, and either one alone misleads. The cost is optics, because your headline completion rate falls the moment you report the population beside it.
Check 9. Record duration on every model and tool span, and time to first chunk on every model span. The OpenTelemetry GenAI conventions already define these. Model calls carry gen_ai.client.operation.duration and gen_ai.client.operation.time_to_first_chunk, tools carry gen_ai.execute_tool.duration, and the whole invocation carries gen_ai.invoke_agent.duration.
Alert on the p90 per route rather than the mean, because a slow tool or a retry loop shows in the tail long before it moves the average.
Record which layer the number came from, too. Cekura measures response time at the main-agent layer rather than from provider-native component timing, and a component figure and an end-to-end figure answer different questions.
The cost is cardinality. A histogram per route, model, and tool multiplies fast, so fix the label set before the first dashboard rather than after the first bill.
Checks 10 to 11: governance and change control
Check 10. Write a post deployment monitoring plan, not just dashboards. The NIST AI Risk Management Framework, published as NIST AI 100-1 in January 2023, organises risk work under four functions: GOVERN, MAP, MEASURE, and MANAGE. Its MEASURE 2.4 subcategory requires that the functionality and behavior of an AI system and its components "are monitored when in production". MANAGE 4.1 asks that "Post-deployment AI system monitoring plans are implemented, including mechanisms for capturing and evaluating input from users and other relevant AI actors, appeal and override, decommissioning, incident response, recovery, and change management."
The operational reading of that is narrow and useful. A dashboard is not a plan. A plan names who looks at what, how often, what threshold triggers action, and who can roll back.
The cost is calendar time rather than engineering time. Someone has to own the document, and a plan nobody reopens after the first quarter is a dashboard with extra steps.
Check 11. Version prompts, tools, and evaluators, and record the version on the span. Prompt changes are deploys. An agent whose quality moved without an application release usually moved because a prompt, a tool definition, or a scoring rubric changed. If none of those carry versions on the trace, you cannot correlate the change with the effect.
Versioning the artifacts and surfacing the version on the span are two separate jobs, and the second is what makes the first legible during an incident. The cost is process. Prompts and rubrics usually sit outside the code review your team already runs, so versioning them adds a review step where none exists today.
Cekura tests agents before release, monitors them in production, and feeds the failures back into the next iteration, which is the loop this checklist is ultimately describing. Cekura scores each conversation against the evaluators you define, keeps the tool level evidence for every run, and surfaces the sessions that need a human. Our guide to monitoring AI chat and voice agents in production covers the production side in more detail. Our agent performance monitoring metrics breakdown covers what to put on the dashboard once the spans exist.
How to roll out the checklist without stalling
An AI monitoring observability checklist is only worth anything once it is built, so do not attempt all eleven at once. The order below front loads the items that make the rest diagnosable.
- Checks 1 and 3 first. Session identifiers and error capture are a day of work and immediately make incidents reconstructable.
- Check 2 next, but scoped to tool spans only. Checks 6 and 7 compare a value the user gave against the value the tool received. Both sides have to be stored before either check can run.
- Check 4 before you have dashboards to migrate. Renaming attributes later is the expensive version of this task.
- Check 9 as soon as check 4's names are in place. The duration histograms ride on the same attributes, so they cost almost nothing extra at that point.
- Checks 6 and 7 once tool spans carry their arguments. Cekura treats a wrong tool argument as one of the clearest defects to catch, because it is unambiguous in a way a quality score never is.
- Check 8 when you start reporting numbers to anyone outside the team.
- Check 5, then check 2 widened from tool spans to every span, as the system stabilises and the questions shift from "what broke" to "what changed".
- Checks 10 and 11 on whatever cadence your governance review already runs.
Check 2 appears twice in that list on purpose. A narrow version has to precede checks 6 and 7, while the full version can wait. Capturing every input and output on every span is the most expensive item here. For agents handling regulated conversations, check 10 moves to the front of the list.
For teams monitoring voice specifically, the audio signals sit alongside these checks rather than inside them. Interruption handling and audio quality each need their own thresholds, and Cekura's voice AI evaluation metrics guide sets out how those are defined and measured.
Frequently asked questions
What is the difference between AI monitoring and AI observability?
AI monitoring tells you a known signal crossed a threshold, while AI observability lets you answer a question you never thought to ask, using data you already collected. For agents the distinction matters because most failures are not anticipated. Span level capture of inputs, outputs, and tool arguments does more work than any single metric.
What should an AI monitoring observability checklist include at minimum?
At minimum, seven things. A session identifier, per span inputs and outputs, error type and traceback, model name and version, tool arguments and results, span duration, and a coverage figure beside every quality score. Those seven let you reconstruct any failure. Everything else on this list improves speed or governance rather than capability.
How do OpenTelemetry GenAI conventions help?
They give you portable attribute names, so instrumentation survives a change of backend. Note that the gen_ai.* attributes are currently marked Development rather than Stable, so expect the names to change and plan for a migration.
Why do failed sessions need to stay in the denominator?
Because removing them changes what the number means. Cekura publishes both figures for the same configuration. Task completion reaches 97.56% over the 205 calls with outcome evidence, while infrastructure reliability is 82.93% across all 246 retained calls, 41 of which never connected. Report both, with the population each covers.
How often should monitoring thresholds be reviewed?
Whenever a prompt, tool definition, model version, or evaluator changes, and on a fixed cadence besides. A threshold tuned to last quarter's behavior quietly stops firing after a model version bump, which is the argument for recording versions on the span in check 11.